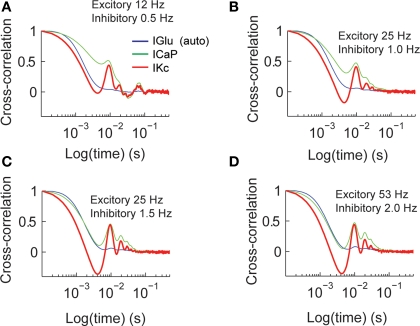
Figure 4.
Cross-correlation analysis of total synaptic excitatory input and dendritic currents. The figures show the auto-correlation of the synaptic current (IGlu, blue), and the cross-correlation of IGlu with ICaP (green), and IKc (red). We repeated this analysis for all the combinations of synaptic activity (A–D).

