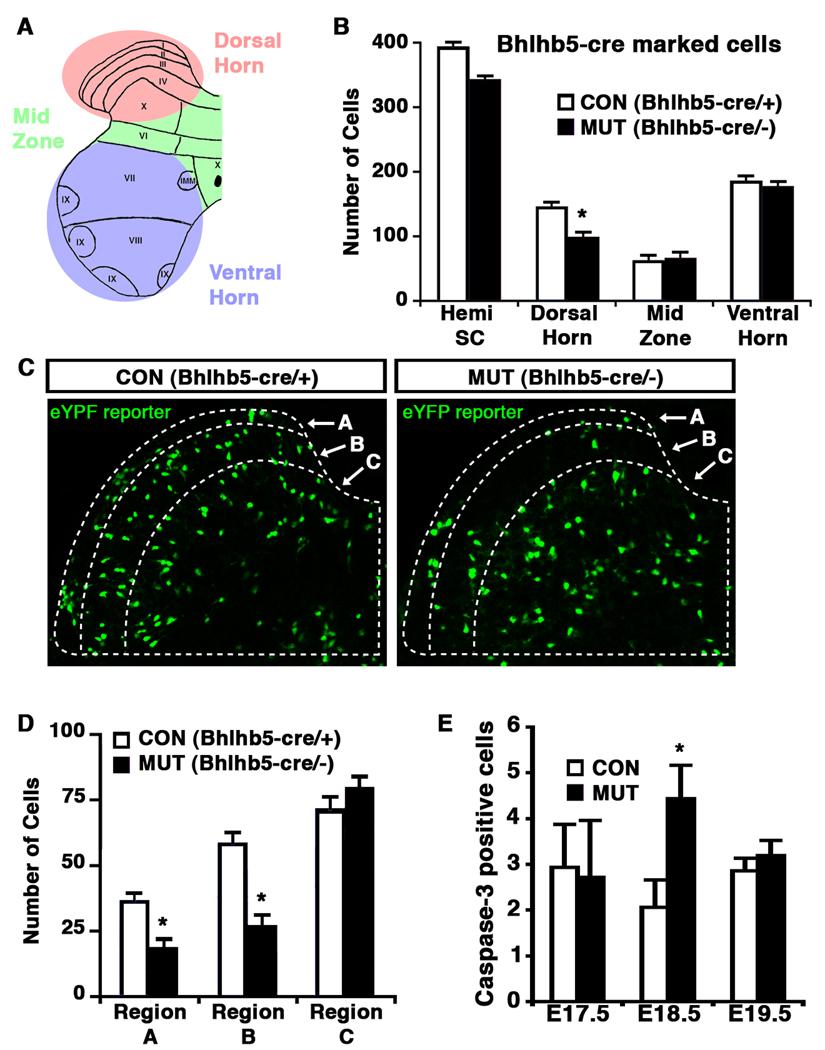
Figure 7. Cell loss in Bhlhb5 mutant mice reflects increased programmed cell death.
A) Schematic illustrating regions within a hemi-spinal cord (dorsal horn, mid zone and ventral horn) that were used for quantification. B–D) Quantification of Bhlhb5-cre marked cells in the lumbar spinal cord of control (Bhlhb5-cre/+) and mutant (Bhlhb5-cre/−) mice, visualized with the cre-responsive Rosa26-eYFP reporter at P0. B) The number of Bhlhb5-cre marked cells observed in various regions of a spinal cord hemisection was quantified. Significantly fewer Bhlhb5-cre marked cells were found in the dorsal horn of Bhlhb5 mutants relative to controls. No significant changes were observed in other regions of the spinal cord. C) Representative images from the dorsal horn of control and mutant mice showing Bhlhlb5-cre marked cells. The dorsal horn was further subdivided into regions based on anti-calretinin antibody staining (which marks region B; data not shown). Note that Rexed’s laminae are not fully formed at this stage and most lamina-specific markers are not expressed. Nevertheless, region A corresponds roughly to future lamina I and region B to future lamina II. D) Quantification of Bhlhb5-cre marked neurons in regions A, B and C, as defined above. There is a significant reduction in the number of Bhlhb5-cre marked neurons within regions A and B of the dorsal horn in mutants relative to controls. No significant change was observed within region C. E) Analysis of apoptotic cells in the dorsal horn of control and mutant animals at E17.5, E18.5 and E19.5, as indicated. Apoptotic neurons in the dorsal horn were identified using an antibody against cleaved caspase-3. Significantly more cleaved caspase-3 positive cells were observed in the mutant dorsal horn at E18.5 relative to littermate controls. For B, D and E, 3 – 5 pairs of littermates were analyzed and data represent mean +/− SEM (*, p < 0.05, Mann-Whitney U-test). Further analysis reveals that the absence of Bhlhb5-expressing neurons in the dorsal horn is due to the loss of both inhibitory and excitatory neurons (Figure S8B).

