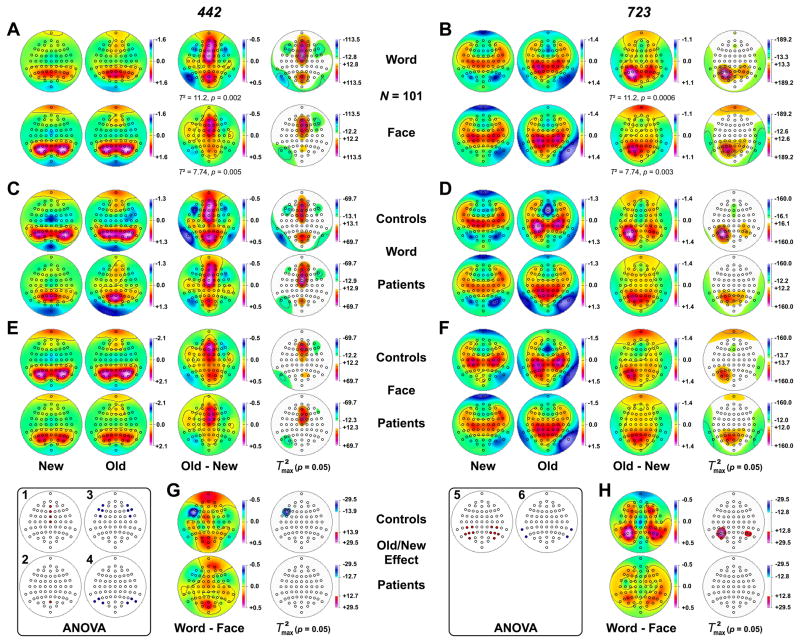
Figure 6.
Statistical evaluation of topographic old/new effects using randomization tests for paired samples for CSD factors 442 and 723, performed across groups for each task (A, B), and separately for 44 controls and 57 patients for words (C, D) and faces (E, F). Task-dependent differences of the old/new effect were also evaluated separately for each group (G, H). Shown are the mean factor score topographies for new and old items and their respective old-minus-new difference (A–F; multivariate Hotelling’s T2 statistics are reported for the total sample), or the old-minus-new difference for words minus the old-minus-new difference for faces (G, H), and squared univariate (channel-specific) paired samples T statistics thresholded at the 95th quantile (p = 0.05) of the corresponding randomization distribution (maximum of all 67-channel squared univariate paired samples T statistics). To facilitate comparisons of the max(T2) topographies with the underlying sink-source difference topographies, the sign of the difference at each site was applied to the respective T2 value, which is otherwise always positive. Please note that symmetric scales optimized for score ranges across new and old stimuli were used for the original topographies. To allow for better comparison of old/new effects across tasks and groups, the same symmetric scale range was used for all difference topographies for each factor, and within each set of max(T2) topographies. All topographies are two-dimensional representations of spherical spline interpolations (m = 2; λ = 0) derived from the mean factors scores or T2 statistics available for each recording site. Inset topographies show the sites selected for repeated measures ANOVA models performed on CSD factors 442 (1–4) and 723 (5–6), as indicated by colored locations (red: old/new effects; blue: inverted old/new effects).

