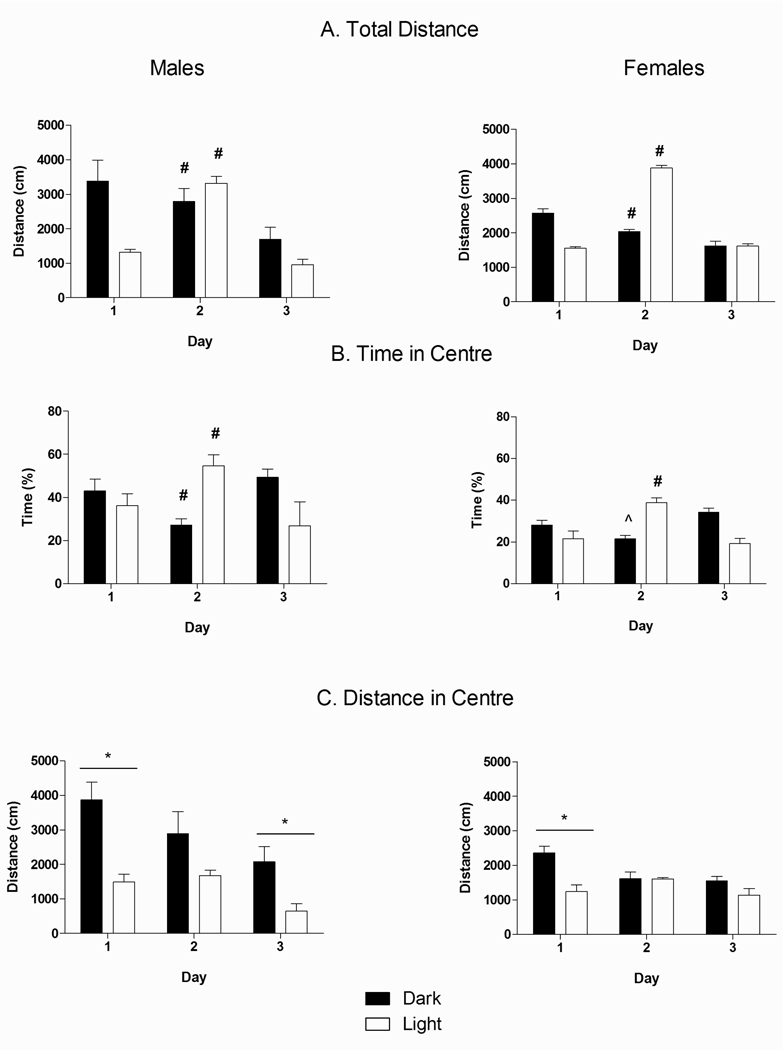
Fig. 2.
Effect of Circadian Phase, Day, and Sex on (A) total distance traveled on the open field; (B) percentage of time in the center of the open field (amount of time in the center/total amount of time in the open field) × 100%); and (C) distance traveled in the center of the open field across the 3 days of testing. Dark bars represent animals tested in their Dark phase (n=8) and transparent bars represent animals tested in their Light phase (n=6). (*) denotes significantly different between Phases, p<0.05. (#) denotes significantly different from other days in Dark animals (p’s<0.05). (##) denotes significantly different from other days in Light animals (p’s<0.05).

