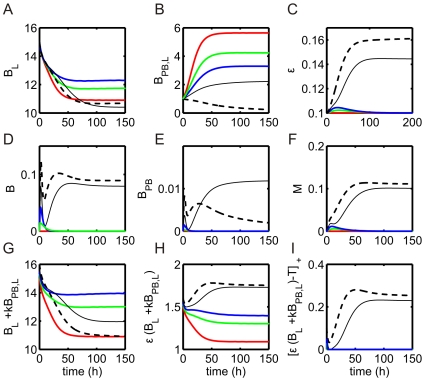
Figure 5. System dynamics in the presence of probiotics.
Health or disease states are predicted as parameter  is varied:
  (red),
  (green),
  (blue),
  (black), and
  (dashed). The system is simulated in the bistable region, with initial pathogenic bacteria insult
  cells/g, pathogenic bacteria growth rate
  h
h , and probiotic bacteria growth rate
  h
h . (A) Bacteria in lumen,
  . (B) Probiotic bacteria in lumen,
  . (C) Permeability,
  . (D) Bacteria in blood/tissue,
  . (E) Probiotic bacteria in blood/tissue,
  . (F) Immune cells,
  . (G) Total bacteria in lumen,
  . (H) Product of luminal bacteria and permeability,
  . (I) Difference between product in (H) and threshold,
  .
.

