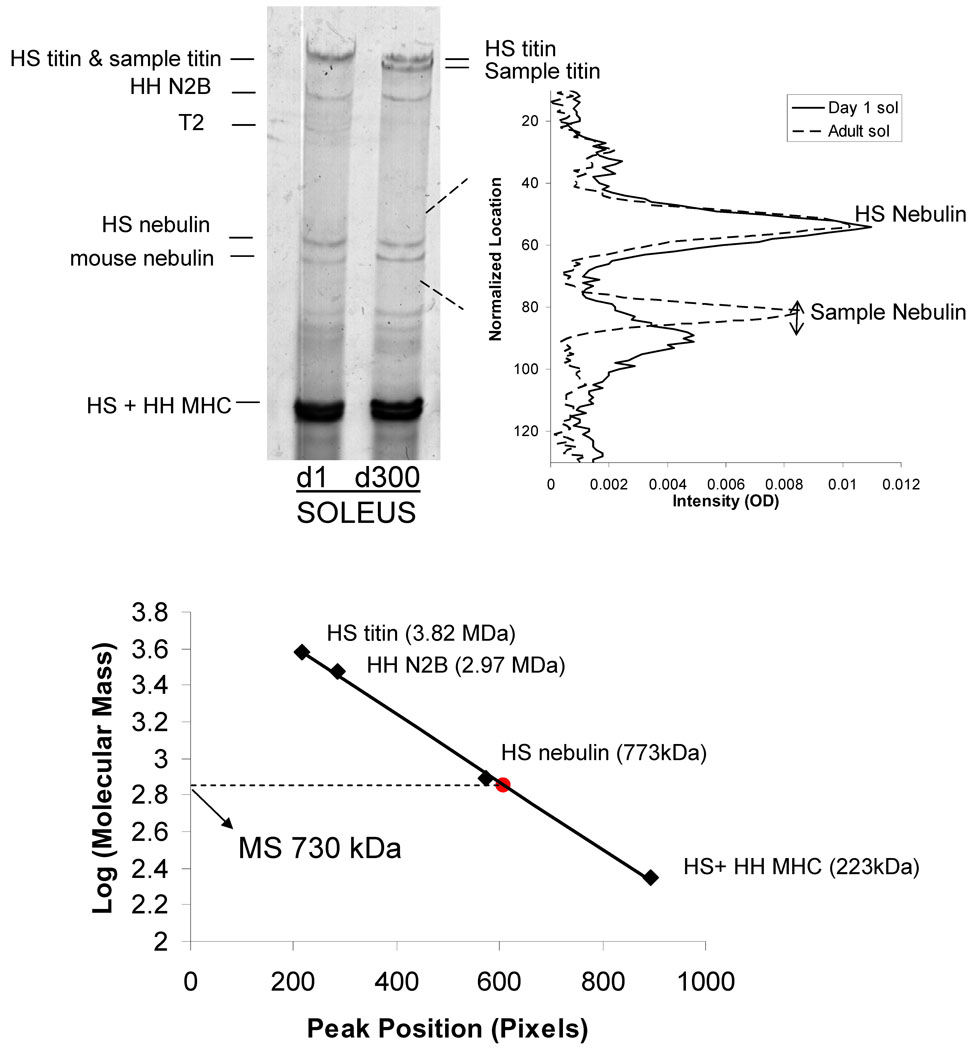
Figure 4.
Nebulin size analysis. Left Panel) SDS-agarose gel electrophoresis from day 1 (d1) and adult (d300) mouse soleus. The sample was co-electrophoresed with human soleus titin and human heart to compare nebulin isoform size. Right panel) Densitometry scan of two lanes (shown at the left) superimposed. Adult soleus nebulin (broken line) is larger in size than the neonate soleus (solid line) as observed by the reduced distance to human soleus nebulin. Bottom: distance of protein bands from top of gel vs log Mw. The known co-electrophoresed standards were used to determine the shown calibration line and this line was then used to estimate the Mw of the mouse soleus (MS) nebulins.

