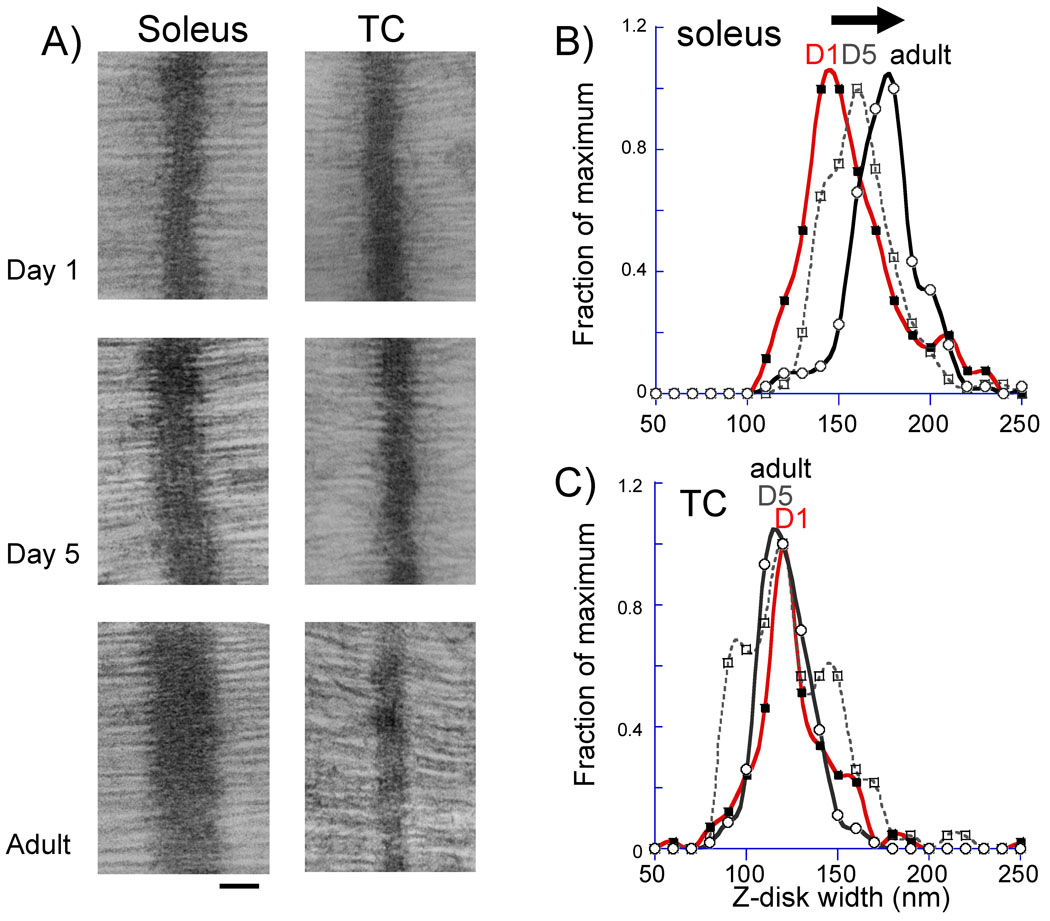
Figure 7.
Z-disc width measurement in neonatal (day 1 and day 5) and adult mice. A) Examples of micrographs for soleus (left) and TC (right) muscle. Bar is 100 nm. B and C) histograms of Z-disc width measurements. Data were binned in 10 nm wide Z-disc bins and each value represents the number of measurements that falls within the bin. (The values are expressed as a fraction of the value of the bin with the most measurements).

