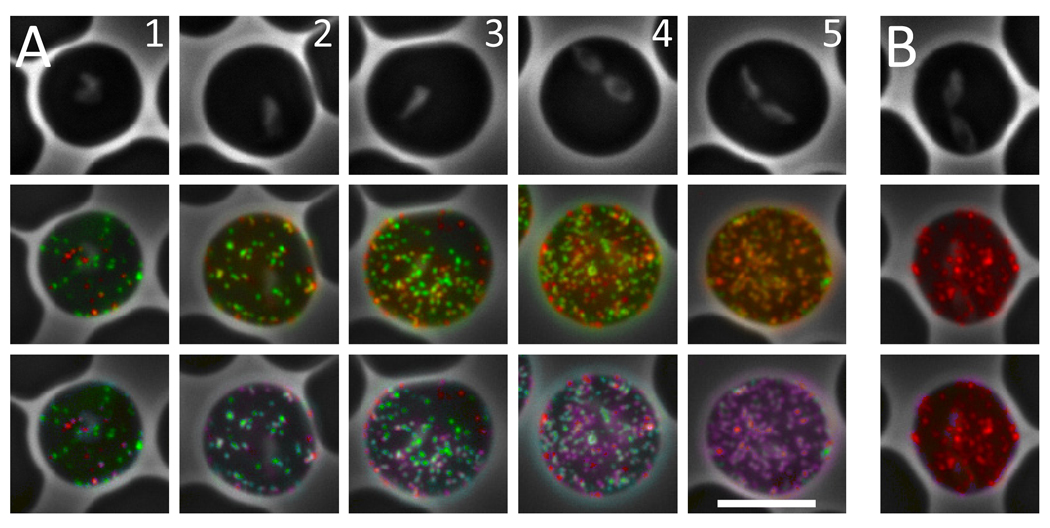
Figure 5. Live-cell immunofluorescence of B. bovis C9.1 line IE.
Mature stage B. bovis C9.1 line IE were reacted with mAb 4D9.1G1 and R6α-v1β765 (panel A; five individual cells of increasing parasite maturity and antigen density are shown) or with mAb 4D9.1G1 and P6 (panel B). Localization of VESA1a by mAb 4D9.1G1 is shown in red and reactivity of the rabbit antisera with VESA1b is shown in green. The top row shows phase contrast images of the individual IE, whereas the second row shows patterns of immunoreactivity superimposed upon the phase contrast images. Note the finely punctate pattern of labeling by rabbit antisera, which is indistinguishable from that of the monoclonal antibody. Co-localization of the two antigens is shown in the bottom row by the superimposition of blue color where red and green signals significantly coincide (ratio ≥0.10 of other signal). Note also the clearly variable ratios of the two antigens, and the occasional signals apparently derived from one antigen only. Single signal foci show up as red or green, whereas co-localized signals appear in varying shades of purple, lavender, and cyan, depending upon the calculated signal ratios. The white bar represents 5 µm; magnification is identical in each image.

