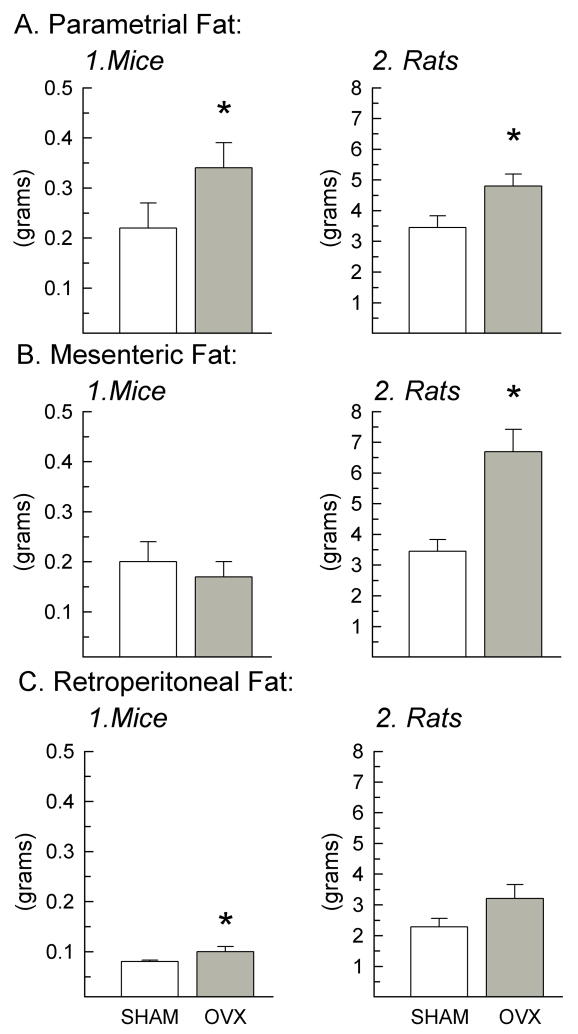
Fig. 4.
Parametrial, mesenteric, and retroperitoneal fat pad weights excised at the termination of the study of OVX (gray bars) and sham (white bars) mice (A1, B1, C1; n = 10/group) and rats (A2, B2, C2; n = 12/group). Data represent mean ± SEM; (*) indicates p < 0.05 in OVX vs. sham animals. Abbreviation: OVX, ovariectomized.

