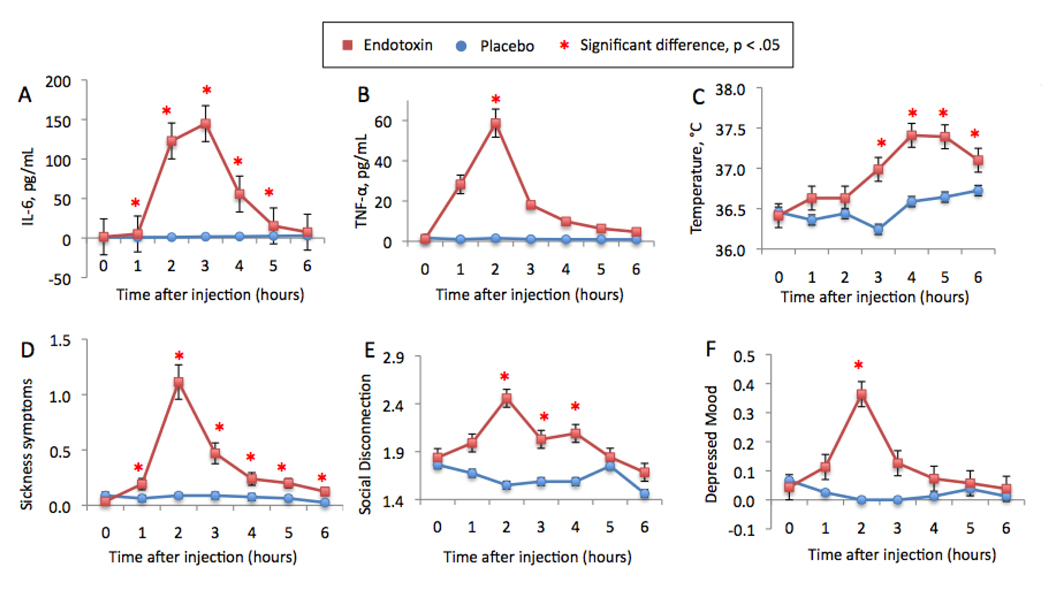
Figure 1.
Changes over time in the endotoxin and placebo groups in: (A) plasma levels of IL-6 (raw values that have not been log-transformed; previously reported in Eisenberger et al., 2009), (B) plasma levels of TNF-α (note that values for T1 and T3-T6 do not include data for all placebo subjects), (C) oral temperature, (D) self-reported sickness symptoms, (E) self-reported feelings of social disconnection, and (F) self-reported depressed mood (previously reported in Eisenberger et al., 2009). Time points with asterisks indicate significant time (baseline vs. each subsequent time point) by condition interactions.

