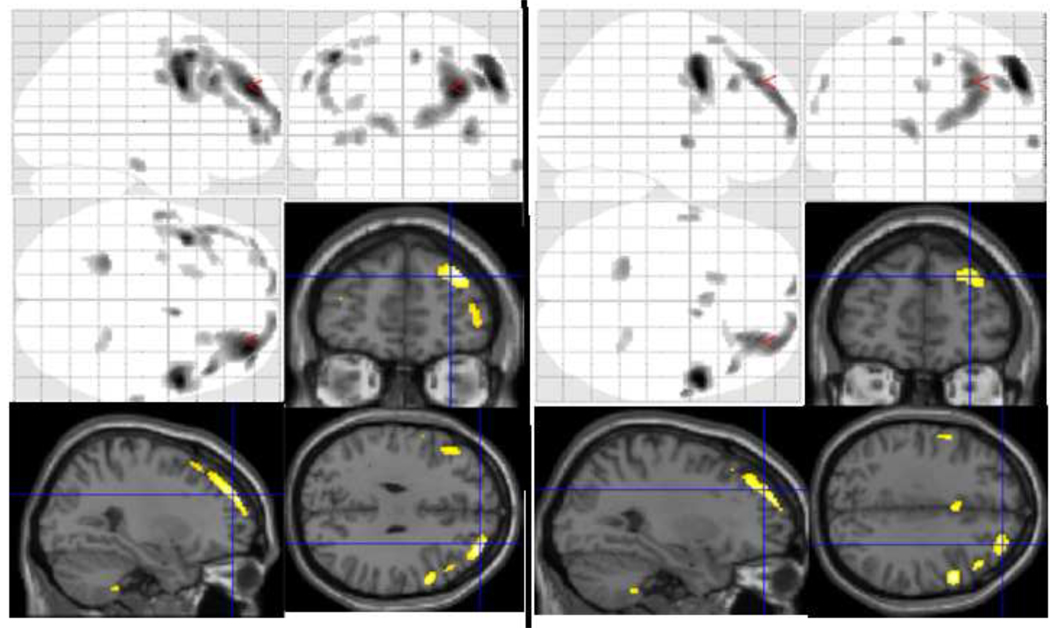
Fig 1.
Glass brain pictures and rendering of significant voxel clusters on to T1 image of grey matter density and volume across HSV1 serological status in the entire sample of cases and controls in a regression model. Left: Regression model included age, sex, SES and diagnostic status with MICB genotypes; Right: Regression model without MICB genotypes as covariates.
See table 3 and table 2, respectively for volumetric differences

