
Figure 3.
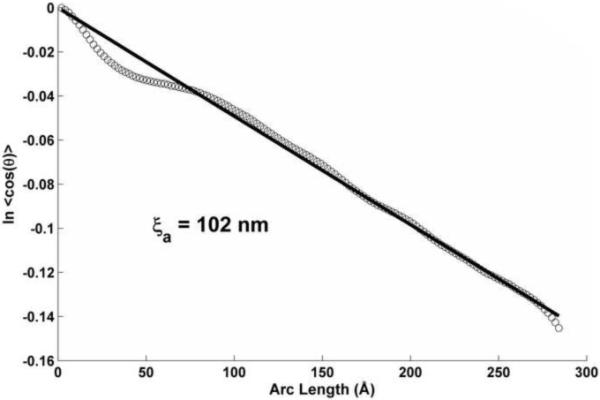
Tangent correlation plot of the angle θ(s) (see Fig. 1A) along EM images of negatively stained tropomyosin molecules, used to get the apparent persistence length ξa from the inverse slope of the linear regression (see Equation 6).
Official websites use .gov
A
.gov website belongs to an official
government organization in the United States.
Secure .gov websites use HTTPS
A lock (
) or https:// means you've safely
connected to the .gov website. Share sensitive
information only on official, secure websites.
Tangent correlation plot of the angle θ(s) (see Fig. 1A) along EM images of negatively stained tropomyosin molecules, used to get the apparent persistence length ξa from the inverse slope of the linear regression (see Equation 6).