
Figure 4.
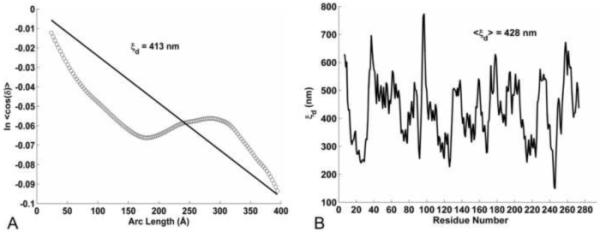
Dynamic persistence length of tropomyosin. (A) Tangent correlation plot of the angle δ(s,t) (see Fig. 1A) along conformers of the MD simulation, used to get the overall dynamic persistence length ξd from the inverse slope of the linear regression (see Equation 7). (B) The local dynamic persistence length, based on the fluctuations of δ(t) over a 9 residues window centered on each residue.