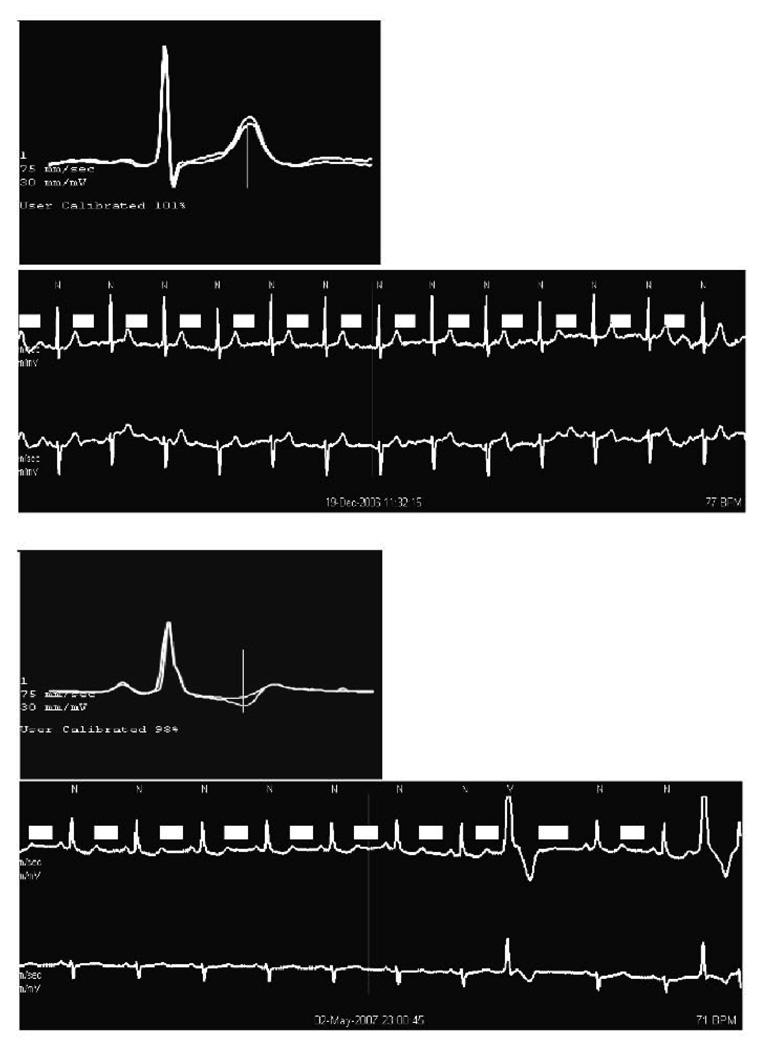
Figure 1.
Holter-based T-wave alternans in two CHS participants. Small boxes are the QRS-aligned templates generated by modified moving average analysis, which show the measurement of the maximum difference between successive sinus beats. The associated ECG strip is shown below it. TWA is 58 µV in the top figure and 61 µV in the bottom one.

