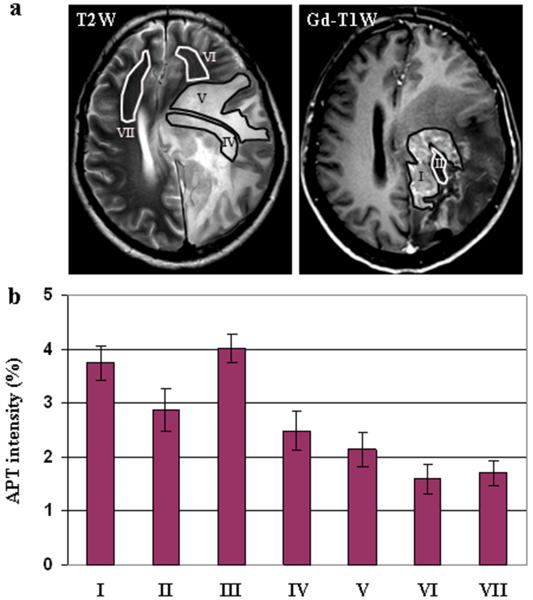
Fig. 6.
Quantitative analysis of the APT images from all patients studied in this work. (a) Examples of the definition of the regions of interest. (b) Average APT intensities and corresponding 95% confidence intervals plotted as a function of tissue type. (I) viable tumor core; (II) necrosis; (III) cystic component; (IV) immediate edema; (V) peripheral edema; (VI) ipsilateral normal-appearing white matter; (VII) contralateral normal-appearing white matter. The APT intensity is the percentage of the bulk water signal.

