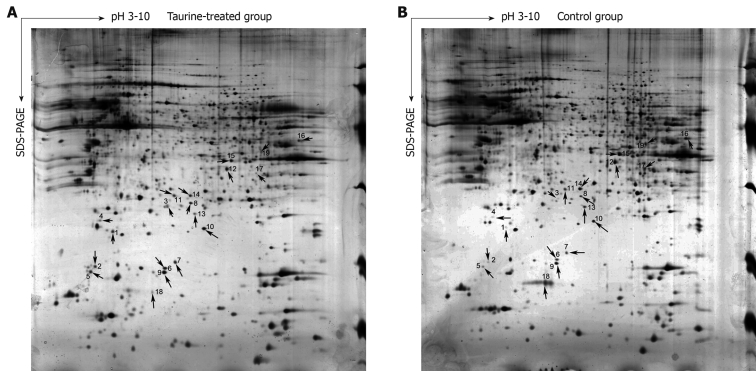
Figure 1.
Two-dimensional gel electrophoresis (2-DE) images of taurine-treated hepatic stellate cells (HSCs) and controls. A: Taurine-treated group; B: Control group. In both images, transverse arrows represent isoelectric focusing and longitudinal ones represent sodium dodecyl sulfate-polyacrylamide gel electrophoresis (SDS-PAGE).

