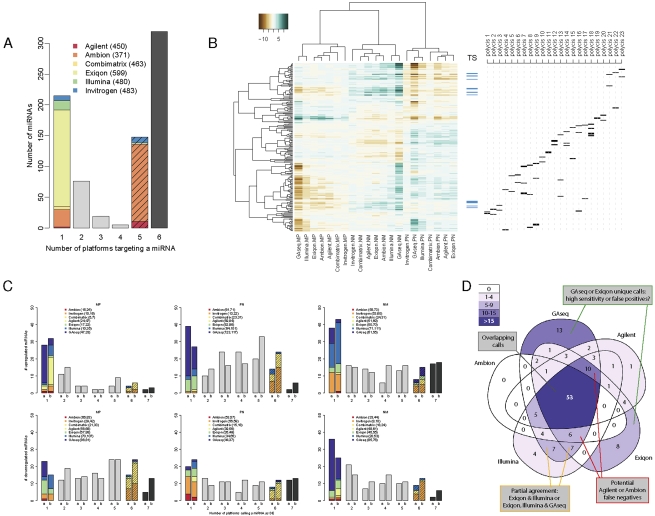
FIGURE 3.
Analysis of differential expression. (A) miRNA targeting by platforms. The number of reannotated miRNAs targeted by varying numbers of platforms was calculated. Solid colors indicate miRNAs found only on the indicated platform; striped colors, miRNAs found on all platforms except the indicated platform. The total number of human miRNAs on each platform is indicated in parenthesis. Black bar indicates 319 miRNAs represented on all microarrays. (B) Clustering of the common probe M-values. M-values of 204 human probes common to all microarray platforms with no predicted cross-hybridization and detectable by GAseq were subjected to unsupervised clustering using Pearson correlation. Ticks indicate the position of potential tumor suppressor (TS) miRNAs (blue) and miRNAs arising from a single genomic location contained in a putative polycistronic pri-miRNA (black). A list of polycistrons is provided in Supplemental file “Polycistrons.” (C) Consistency of DE calls by all platforms. The number of platforms calling each miRNA as DE (up-regulated, top; down-regulated, bottom) in each of the three biological comparisons was recorded. DE calls were derived (1) using a uniform threshold of log2 fold-change>1 or (2) using optimal thresholds calculated for each platform by the iMLE algorithm. The overall number of relevant DE calls made by each platform is indicated in parenthesis. (D) Overlap in DE calls of five platforms. The number of miRNAs called by five platforms as up-regulated in P versus N sample using iMLE-optimized cutoffs was plotted inside a Venn diagram. Areas are shaded according to number of DE calls and their relative sizes bear no meaning.

