Figure 4.
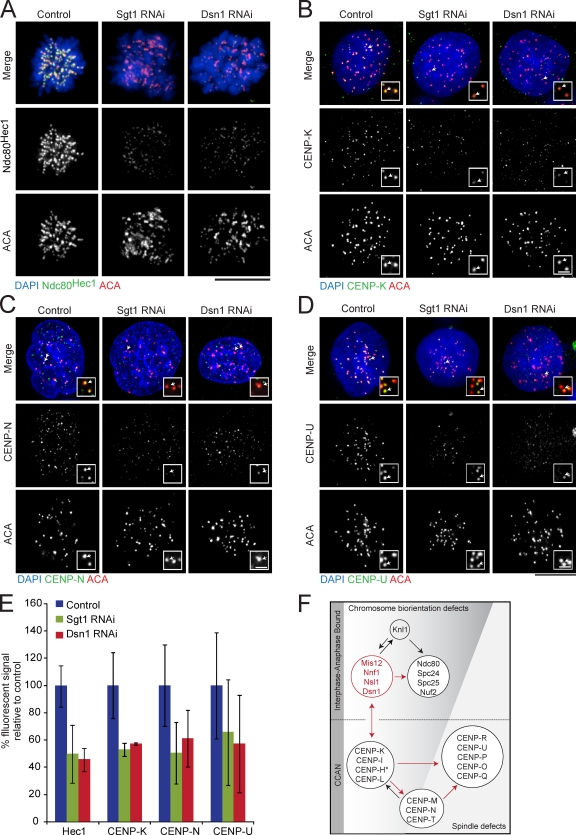
Sgt1 and Dsn1 target a complementary set of kinetochore proteins. (A–D) HeLa cells were treated with control, Sgt1, or Dsn1 siRNAs for 72 h and prepared for immunofluorescence analysis using antibodies to Ndc80Hec1, CENP-K, CENP-N, CENP-U, or ACA as indicated. Chromosomes were stained with DAPI. Insets highlight the kinetochore foci indicated by the small arrows in the merged image and are enlarged 3.5-fold. Bars: (main panels) 10 µm; (insets) 1 µm. (E) Fluorescent signals were quantified as in Fig. 1 D. P-values were <0.05 for all treated samples with the exception of CENP-U, which exhibited a high degree of signal variation. Error bars represent the deviation from the mean observed in multiple kinetochores and cells. (F) Diagram of kinetochore–protein interactions based on our genetic analyses and published data (Foltz et al., 2006; Okada et al., 2006; Cheeseman et al., 2008). The Mis12 complex and arrows are highlighted in red to represent potential direct or indirect interaction pathways within the kinetochore network.

