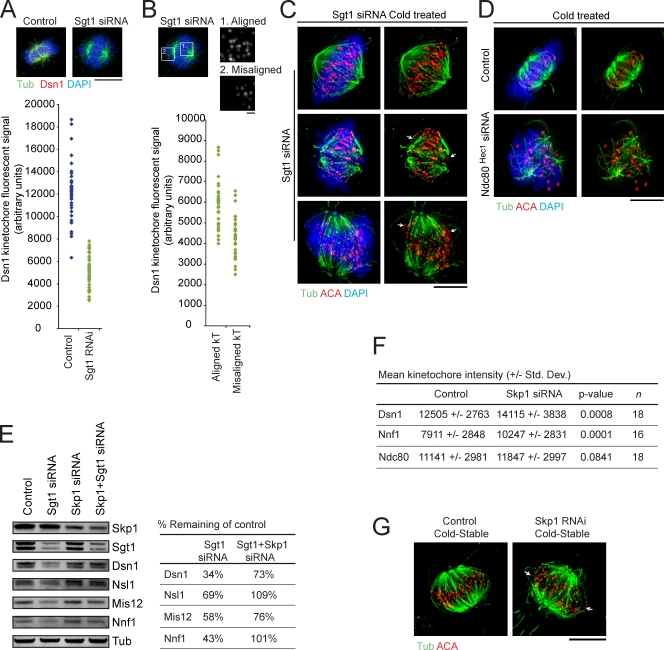
Figure 8.
The balance of assembly and turnover of Mis12 complexes contributes to the efficiency and distribution of microtubule attachment sites. (A) The fluorescent signal associated with Dsn1 at kinetochores was quantified in cells treated with control (blue) or Sgt1 siRNA (green). Signals for each kinetochore from multiple mitotic cells are represented in the scatter plot. The fluorescent cell images are examples of the data used for the plot. (B) The fluorescent signals from kinetochores only from cells treated with Sgt1 siRNA were divided into two populations: those from kinetochores of aligned or misaligned chromosomes. The signals from these two populations are represented in a scatter plot. The grayscale images on the right highlight the boxed regions as examples of Dsn1 fluorescence from aligned or misaligned kinetochores. After treatment with Sgt1 (C), control, or Ndc80Hec1 (D) siRNAs, cells were briefly cold-treated to destabilize nonkinetochore microtubules (see Materials and methods). Cells were processed for immunofluorescence and stained for tubulin, ACA, and chromosomes with DAPI. Multiple images for cells treated with Sgt1 siRNA exemplify the heterogeneity of kinetochore defects. Arrows indicate unattached kinetochores. (E) HeLa cells were treated with control, Sgt1, or Sgt1 and Skp1 siRNAs for 72 h, and extracts were subject to immunoblot analysis of the indicated proteins. The fluorescent signals associated with the indicated proteins (Dsn1, Nsl1, Mis12, and Nnf1) were quantified, and control treatment was set to 100%. Signals were normalized to tubulin, which serves as a loading control. (F) After treatment of HeLa cells with control or Skp1 siRNA and processing for immunofluorescence, the maximum fluorescent intensities of kinetochore-associated Dsn1, Nnf1, and Ndc80Hec1 from multiple mitotic cells were quantified. P-values were obtained from a two-tailed Student’s t test. (G) HeLa cells were treated with control or Skp1 siRNAs for 72 h and briefly cold-treated to eliminate non–kinetochore-bound microtubules. Cells were processed for immunofluorescence and stained with ACA and tubulin antibodies. Arrows indicate kinetochores with little or no associated microtubule signal. Bars: (A and B, left) 10 µm; (B, right) 1 µM; (C, D, and G) 10 µM.

