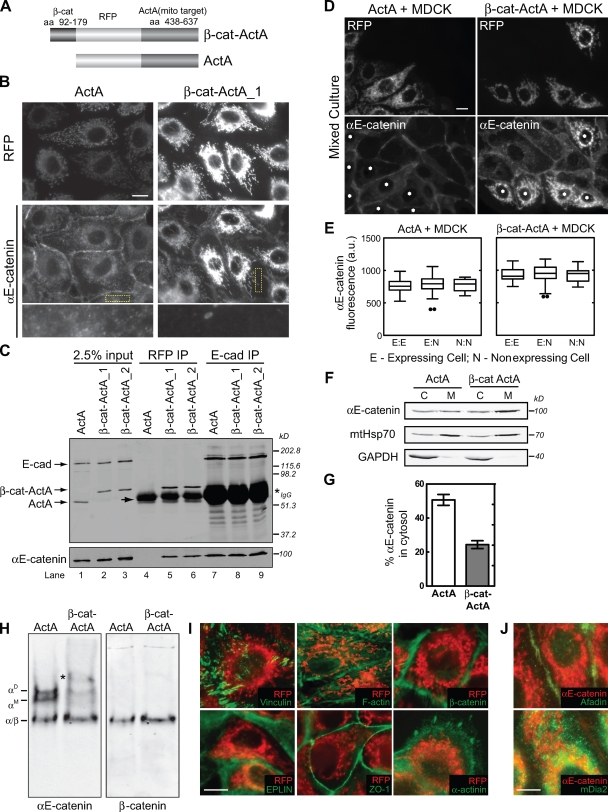
Figure 3.
Targeting endogenous αE-catenin to mitochondria depletes the cytosolic αE-catenin pool. (A) Schematic of αE-catenin mitochondrial-targeting constructs. β-Cat–ActA, minimal αE-catenin–binding domain of β-cat (aa 92–179) fused to mRFP and the mitochondrial targeting region (aa 436–637) of ActA. ActA, control construct containing mRFP fused to aa 436–637 of ActA. (B) RFP and αE-catenin staining of β-cat–ActA and ActA MDCK cell lines. Yellow boxes highlight magnified regions shown in the bottom row. (C) Coimmunoprecipitation of αE-catenin from β-cat–ActA and ActA lysates using either RFP (lanes 4–6) or E-cadherin (lanes 7–9) antibodies. Blots probed for E-cadherin and RFP (top) and αE-catenin (bottom) are shown. Note that ActA migrates slightly faster than the IgG heavy chain (arrow). Asterisk marks cross reacting IgG heavy chain. β-Cat–ActA_1 and β-cat–ActA_2 were two independent, stable cell lines. (D) ActA- or β-cat–ActA-expressing MDCK cells (asterisks) mixed with wild-type MDCK cells and stained for αE-catenin. (E) The mean level of αE-catenin at cell–cell contacts was quantified between two expressing cells (E/E), an expressing and nonexpressing MDCK cell (E/N), and two nonexpressing MDCK cells (N/N). Results are presented in a box and whisker format. The ends of the box mark the upper and lower quartiles, the horizontal line in the box indicates the median, and the whiskers outside the box extend to the highest and lowest value within 1.5 times the interquartile range. Outliers are represented as dots. About 30 cell–cell contacts for each condition were measured. (F) Cytosol (C) and membrane (M) fractions from β-cat–ActA and ActA stable cells were separated by SDS-PAGE and blotted for αE-catenin, mtHsp70, and GAPDH. (G) αE-catenin band intensities shown in F were measured, and the percentage of αE-catenin in the cytosol fraction is graphed. (H) Native PAGE of ActA and β-cat–ActA cytosol blotted for αE-catenin (left) and β-cat (right). An additional slow-migrating band (asterisk) present in β-cat–ActA cytosol cross reacted with RFP (not depicted) and is presumed to be an αE-catenin/β-cat–ActA heterodimer synthesized in the cytoplasm that binds posttranslationally to mitochondria. (I) Immunofluorescence of EPLIN, ZO-1, α-actinin, β-cat, F-actin, vinculin (all shown in green), and RFP (red) in β-cat–ActA cells. (J) Immunofluorescence of αE-catenin (red) and afadin and mDia2 (green) in β-cat–ActA cells. Bars, 10 µm. Error bars represent SEM from three independent experiments.

