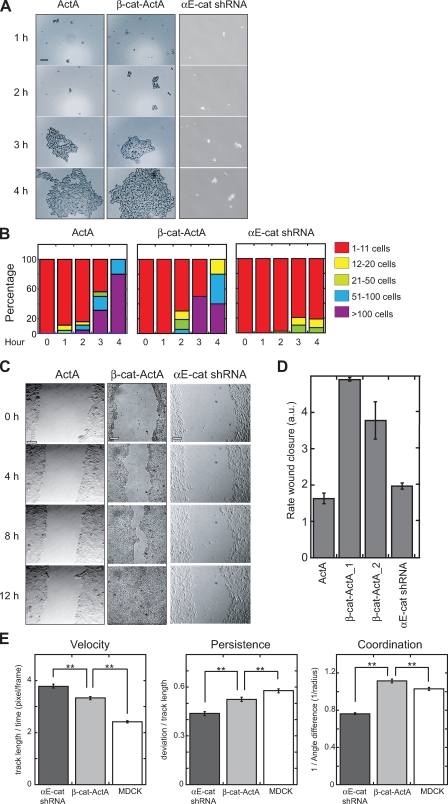
Figure 4.
Sequestration of cytosolic αE-catenin to mitochondria increases cell migration but does not disrupt cell–cell adhesion. (A) ActA, β-cat–ActA, and αE-cat shRNA cell suspensions were triturated, fixed, and imaged at the indicated times. (B) Cell clusters were binned into the following classes: 1–11, 12–20, 21–50, 51–100, or >100 cells, and the percentage of cell clusters in a bin class at a given time point is shown. Data shown are a representative example from two independent experiments. (C) Confluent monolayers were scratched (0 h) and imaged over time to track wound closure. (D) Rate of wound closure was measured and plotted as the mean width of the wound over time and defined in arbitrary units (au). Data shown are a representative example from two independent experiments. (E) 250–400 individual cells from each cell type were tracked for 2 h during wound closure. Velocity is defined as length of track/time. Coordination is defined as 1/radius (the inverse of the mean difference of angle between a target cell and neighbors; the lowest possible value is 2/π [∼0.64], and the highest is infinity). Persistence is defined as deviation/track length (the lowest possible value is 0, and the highest is 1). Error bars indicate SEM. **, P < 0.002 (Mann-Whitney test). Bars, 100 µm.

