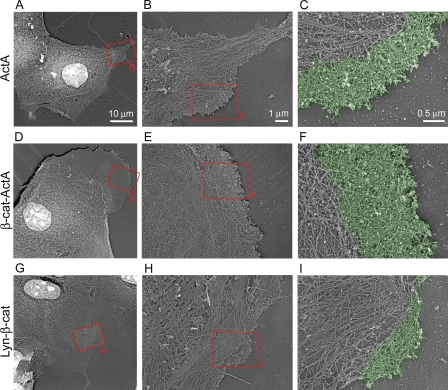
Figure 8.
Perturbation of cytosolic and membrane-associated αE-catenin pools alters actin ultrastructure. (A–I) Platinum replica electron microscopy of membrane protrusions from control ActA (A–C), β-cat–ActA (D–F), and Lyn–β-cat (G–I) cells. Red boxes denote magnified regions shown in the indicated panel. Pseudo coloring in C, F, and I highlight lamellipodia.

