
Figure 7. Model for the establishment of abdominal Hox expression patterns.
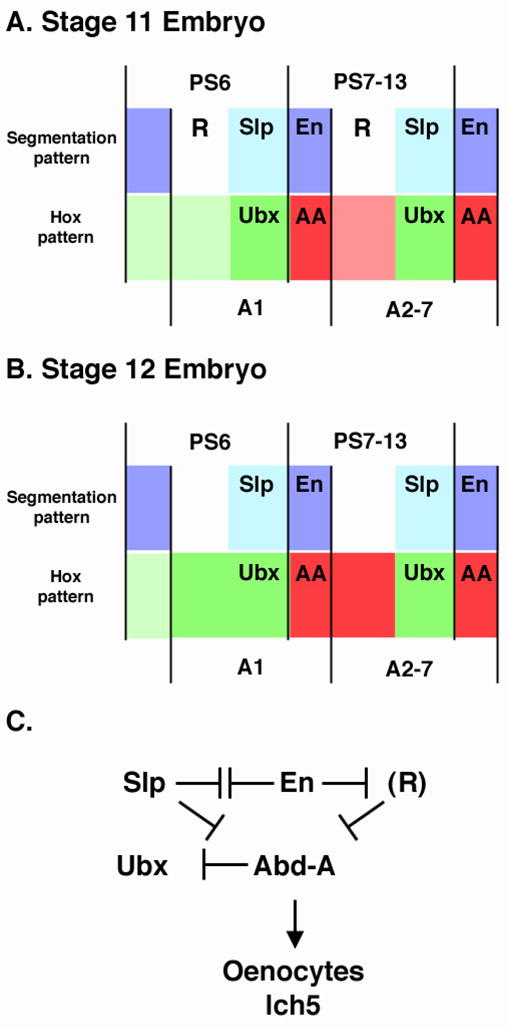
A and B. Representation of En (purple), Slp (blue), Abd-A (red) and Ubx (green) expression levels in stage 11 (A) and stage 12 (B) within two parasegments/segments of an embryo. The segment and parasegment boundaries are denoted. The color intensities represent the relative expression levels of both Hox factors. Note that at stage 11 high levels of Abd-A are observed only within En-positive cells and that high levels of Ubx are observed within Slp-positive cells. We predict that an unknown repressor (R) keeps Abd-A levels low in cells anterior to slp expression. By stage 12, however, the expression of R decreases allowing Abd-A levels to increase in these A compartment cells. In the ventral ectoderm slp expression represses abd-A allowing Ubx levels to be maintained. C. A genetic diagram for how the expression patterns of Ubx and abd-A are established by en and slp. R is shown in parentheses as we predict it is expressed transiently during stage 11 and fades by stage 12. The modulation of abdominal Hox gene expression in the P compartment correlates with the formation of abdominal specific cell fates, oenocytes and the lateral chordotanal organs (lch5).