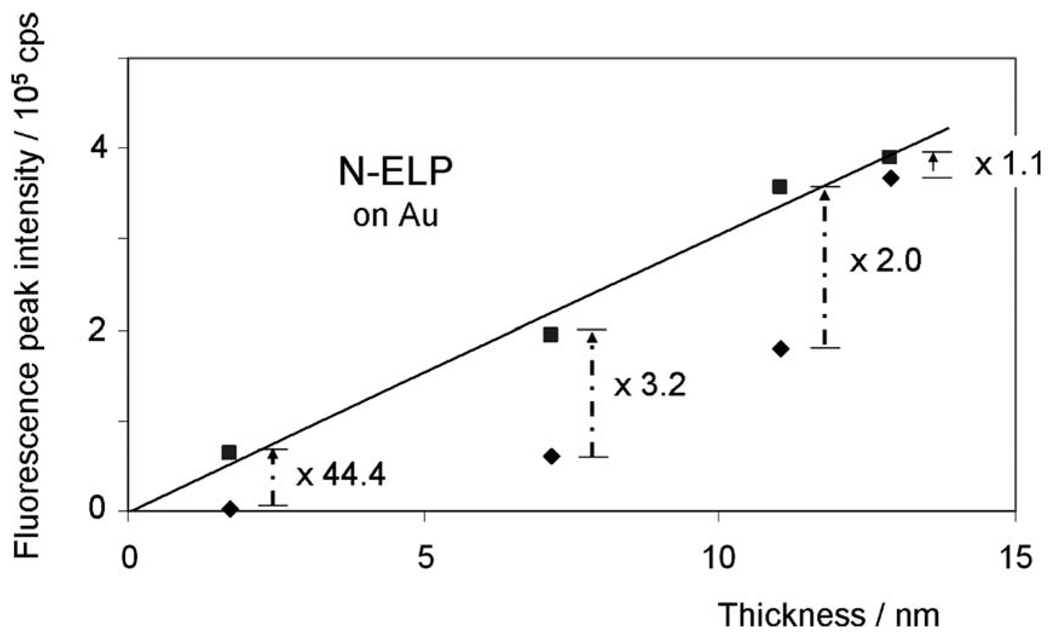
FIG. 4.
Correlation (linear fit) of ELP thickness and fluorescence peak intensities of SPFS angular scans after the stepwise binding of N-ELPs (♦)and unlabeled ELPs (■), respectively, on bare Au substrate with four different graft densities at a solution ionic strength of 10 mM. The numbers show the increment of fluorescence peak intensity after the immobilization of unlabeled ELPs.

