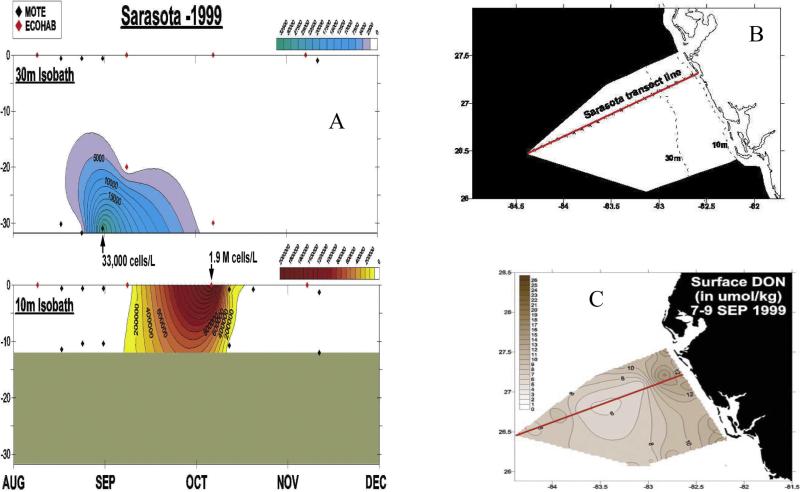
Figure 14.
The (a) weekly distributions of Karenia brevis above the 30-m and 10-m isobaths during August–December 1999 of (b) the Sarasota, FL transect in relation to (c) surface DON stocks (umol kg–1) during September 1999, when the nitrate stocks were then <0.3 umol NO3 kg–1 over the water column. The sampling interval was ~7 days (www.floridamarine.org), but only the occasions when K. brevis were present (>1000 cells l–1) are shown in Figure 14a.

