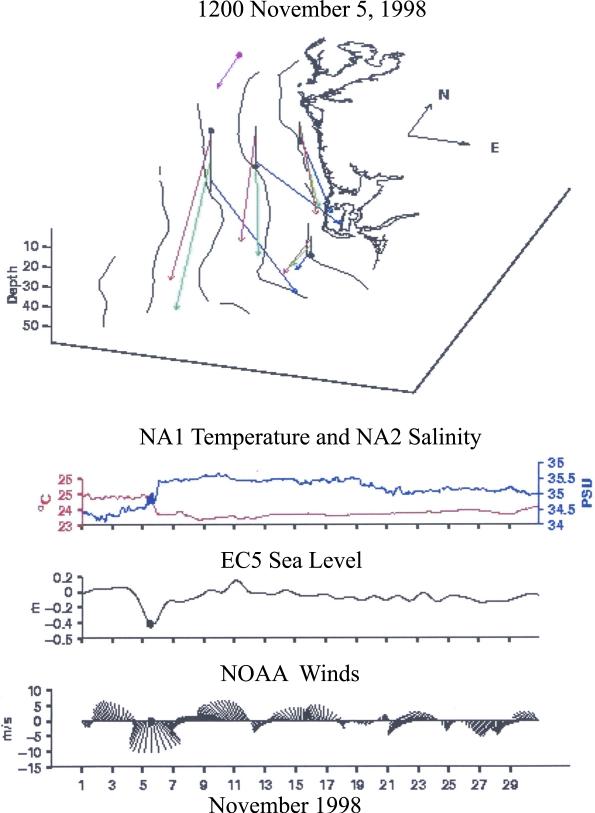
Figure 18.
The three-dimensional current structure at noon on 5 November 1998 at the ECOHAB/HyCODE moored arrays, in relation to daily records of wind forcing at the NOAA offshore buoy, temperature and salinity at the 25-m isobath of the Sarasota, Fl transect, and sea level at St. Petersburg, FL, during November 1998. The red, green, and blue colored vectors denote near-surface, middepth, and near-bottom flows.

