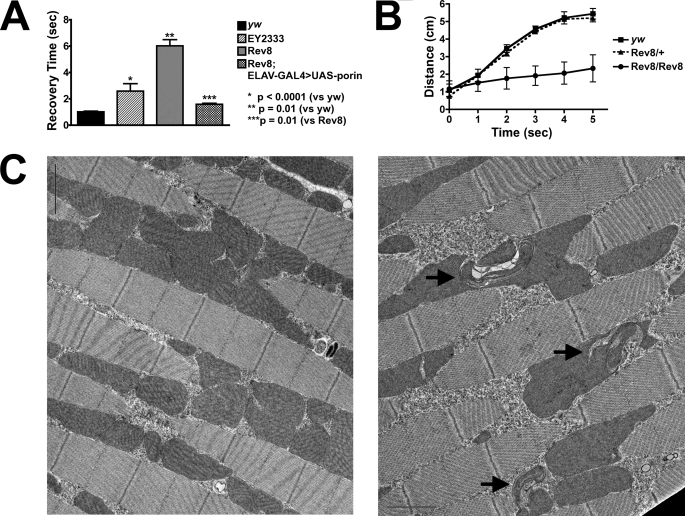
FIGURE 4.
porin mutants demonstrate neurologic dysfunction and abnormal muscle mitochondria. A, bang sensitivity assay. The mean recovery time in seconds for each of the indicated genotypes is depicted. ELAV-GAL4 is a CNS-specific GAL4 driver (22). The error bars represent S.E. Statistical significance was evaluated by the Student's t test with Welch correction. Sample size for each genotype: yw (n = 50); porinEY2333 homozygotes (n = 20); porinRev8 homozygotes (n = 93); and rescued porinRev8 homozygotes (n = 78). B, locomotion assay. Graph depicts distance traveled from bottom of vial over time for flies of the indicated genotypes. Each data point represents the average median distance for a population of 20 males. The error bars represent one S.D. for three to four replicates. EY2333, porinEY2333; Rev8, porinRev8. C, a representative EM section from indirect flight muscle for wild type (left) and mutant (right) is shown. The black arrows in the mutant EM section indicate mitochondria with abnormal cristae.

