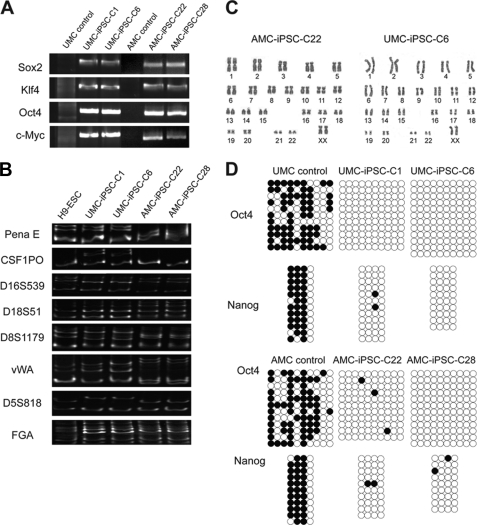
FIGURE 4.
Additional characterization of UMC and AMC iPSCs. A, semi-quantitative RT-PCR shows integration of the exogenous factors into the genomic DNA of selected UMC and AMC iPSC colonies, donor cells were included as the negative control. B, selected microsatellite markers were amplified by semi-quantitative PCR in the indicated cell types, the different banding patterns exclude the possibility of cross-contamination. C, karyotype analysis demonstrates normal number of chromosomes (23 pairs) in selected iPSCs (passage 16). D, DNA methylation profile of the Oct4 and Nanog proximal promoters in the indicated iPSCs (passage 16), donor cells are included as control. White circles indicate unmethylated CpGs, and black circles indicate methylated.

