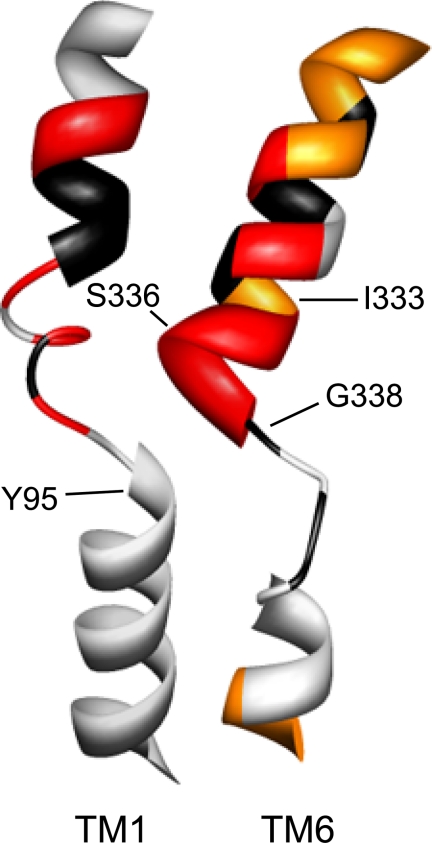
FIGURE 9.
Homology model of hSERT TM6. Homology models of hSERT TM1 and TM6 are depicted as constructed by Kaufmann et al. (32), based on LeuTAa structures. TMs 1 and 6 are viewed perpendicular to the plasma membrane with the remaining TMs removed for clarity. Depiction of TM1 and TM6 SCAM results are from this study and from Henry et al. (42). Residues that are intolerant of Cys substitution are depicted in black; residues that are sensitive to MTS inactivation of uptake are depicted in red, and additional residues that are detectable by MTSEA-biotin but not functionally sensitive to MTS reagents are represented in orange.

