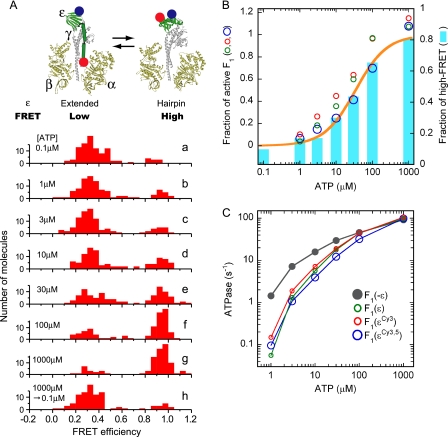
FIGURE 1.
Correlation between the conformational state of ϵ and the ATP hydrolysis activity of Bacillus PS3 F1. Two introduced cysteines, ϵE31C and ϵ134C, were labeled by Cy3 and Cy5 randomly. F1(ϵCy3.5) was immobilized on a grass slide and excited at 532 nm. Fluorescent intensities of Cy3 and Cy5 of each molecule were used for calculation of FRET efficiency, EFRET = ICy5/(ICy3 + ICy5). A, shown is a schematic illustration of ϵ subunit conformational change in F1 and the distributions of FRET efficiency measured at different ATP concentrations (a–h; 100–110 molecules analyzed in each). F1 was incubated with the indicated [ATP] for 1 h (30 min in the case of 1 mm ATP) at 25 °C before fixation to the glass slides. [ATP] in the solution for fluorescence observation infused after fixation was the same as in the incubation buffer except for h. In h the incubation was done in the presence of 1 mm ATP, whereas 0.1 μm ATP solution was infused after fixation; observation was started 10 min later. The ATP-regenerating system was present in all experiments. B, shown is the correlation between the fraction of high FRET and the fraction of active F1. A FRET efficiency of 0.8–1.2 was defined as high FRET. Cyan bars represent the fractions of high FRET from the histograms in A, and ATP hydrolysis activities of F1(ϵ), F1(ϵCy3), and F1(ϵCy3,5) divided by that of F1(−ϵ) (taken from C) are plotted as green, red, and blue circles, respectively. The fractions of high FRET were fitted assuming a simple binding reaction after the fraction of the non-FRET pair was omitted (orange line). The apparent Kd from the fit was 34 μm. C, shown is ATP hydrolysis activity of F1(−ϵ),F1(ϵ), F1(ϵCy3), and F1(ϵCy3,5). ATP hydrolysis rate was measured in the presence of ATP-regenerating system at 25 °C. Velocities were taken at 3550–3600 s (1750–1800 s in the case of 1 mm ATP) after initiation of the reaction. Values were the average of two measurements.

