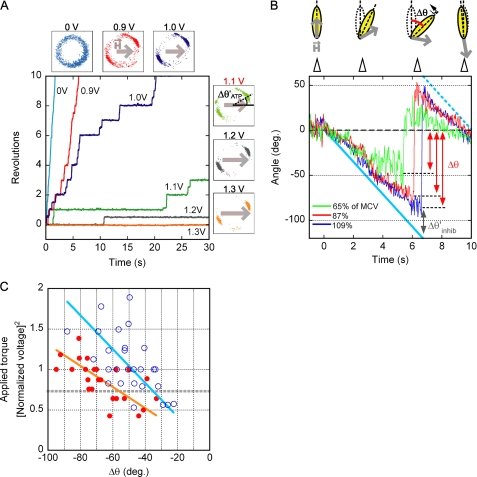
FIGURE 3.
Stiffness of ϵ-inhibited F1 and ADP-inhibited F1. A, shown is determination of MCV. A magnetic field of a different strength was applied to F1, rotating in the presence of 1 mm ATP. An example of rotational trajectories is shown. Small square panels show the magnetic bead centroid position for each voltage tried; gray arrows indicate the direction and the strength of magnetic field. MCV was defined for each individual rotating bead as the voltage that clamped the bead for more than 3 s on average. In the example, MCV was determined as 1.1 V. Δθ′ATP indicates angular deviation of beads from the direction of magnetic field when ATP-driven rotation was clamped at MCV. B, stiffness measurement is shown. The inhibited F1 molecules were rotated at 0.05 Hz by magnetic tweezers at various voltages. In this example, ADP-inhibited F1(−ϵ) was rotated at 65, 87, and 109% of MCV (green, red, and blue, respectively). If the stiffness of inhibited F1 was greater than the trapping stiffness of the magnetic tweezers, beads could not follow the angular movement of the magnetic field and escaped from trapping. The maximum angular deviation from the initial angle (Δθ) was measured, and angular deviation of the beads from the direction of the magnetic field (Δθinhib′ = angular displacement of the magnetic field − Δθ) was obtained. Cyan bold and dotted lines indicate the magnetic field angle. C, stiffness of ϵ-inhibited F1 and ADP-inhibited F1 is shown. Δθ values of ϵ inhibition and ADP inhibition (blue open circle and red filled circle, respectively) were plotted against the square of manipulation voltage, which were normalized by MCV (ϵ inhibition, n = 27, 5 molecules; ADP inhibition, n = 25, 5 molecules). Linear fits for each data set are shown as orange (ADP inhibition) and cyan (ϵ inhibition) lines. The gray dotted line indicates the approximate torque of ATP-driven rotation of F1 (supplemental text).

