FIGURE 1.
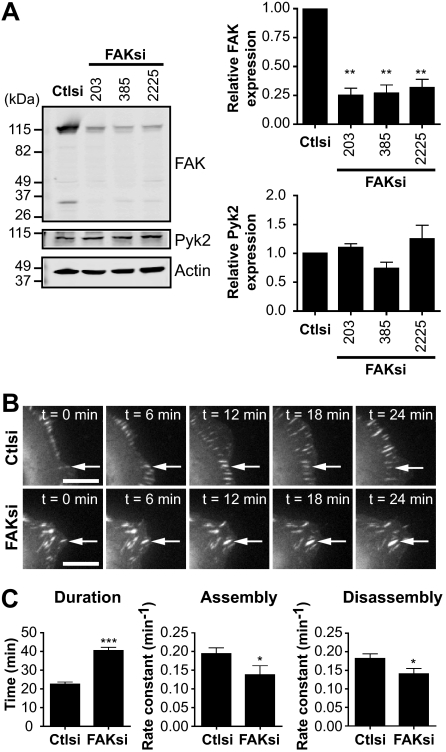
FAK regulates adhesion turnover in HEK 293 cells. A, cell lysates from HEK 293 cells transiently transfected with control siRNA (Ctlsi) or FAK siRNA (FAKsi; FAKsi-203, FAKsi-385, FAKsi-2225) were analyzed by immunoblotting and probed for FAK and Pyk2. Actin was probed as a loading control. Immunoblots shown are from one of four separate experiments. Quantification of relative FAK or Pyk2 expression is defined as the ratio of FAK or Pyk2 to the expression in control siRNA. Relative FAK or Pyk2 expression is shown as the mean ± S.E. **, p < 0.01 (by one-way analysis of variance) compared with control siRNA. B, GFP-talin1 was transiently cotransfected with control or FAK (FAKsi-203) siRNA into HEK 293 cells. Cells were plated on fibronectin-coated glass-bottom dishes and analyzed by time-lapse fluorescence microscopy. Time-lapse montages demonstrate representative images of the dynamics of GFP-talin1 over a period of 24 min. Scale bars = 10 μm. Arrows indicate a representative adhesion. Representative movies are shown in supplemental Movies 1 and 2. C, duration was measured as the time elapsed between the appearance and dissolution of an observed adhesion. Rate constants for net adhesion assembly and disassembly were calculated from plots of fluorescence intensities of GFP-talin1 as described under “Experimental Procedures.” Data for each condition are the mean ± S.E. of a total of six cells over three independent experiments. *, p < 0.05; ***, p < 0.001 (by t test) compared with control siRNA.

