FIGURE 6.
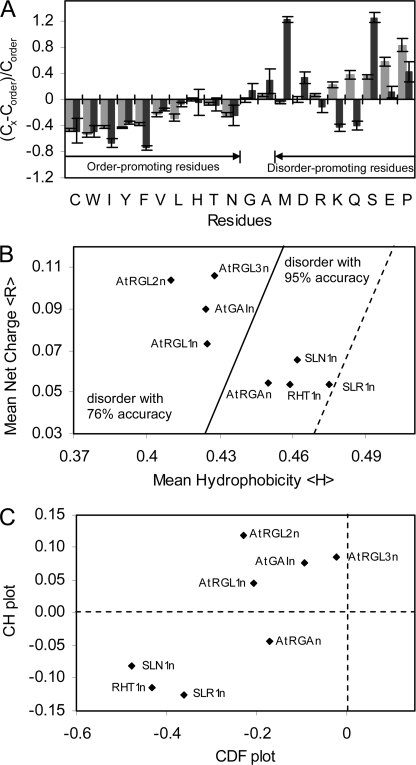
Primary sequence and disorder analyses. A, deviations of average amino acid frequencies of N-domains of DELLAs (black bars) and disordered proteins of DisPro data base (gray bars) from average values of ordered protein data base. The fractional difference was calculated as (CX − Corder)/Corder, where Cx is the content of a given amino acid in eight N-domains of DELLAs studied or a set of well characterized IUPs from DisProt, and Corder is the corresponding content in a set of ordered proteins. B, mean net charge versus mean hydrophobicity plot of N-domains of DELLAs. The major boundary line (solid) (〈R〉 = 2.785〈H〉 − 1.151) distinguishes natively disordered (left side of the line) from ordered proteins (right side of the line). A boundary margin of +0.045 (dotted) extends the disorder estimation accuracy to 95%. C, combined CDF CH plot of N-domains of DELLAs. y axis, distance of each DELLA protein from major boundary line in CH plot (positive for disordered, negative for ordered or small number of disordered); x axis, distance of each DELLA protein from boundary line in CDF plot (positive for ordered, negative for disordered).

