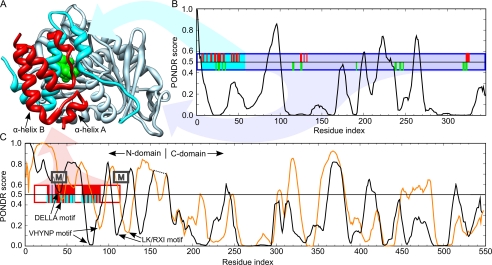
FIGURE 7.
Comparison of the PONDR disorder predictions for AtGID1a, AtGAI, and AtRGL2 with the x-ray crystal structure of AtGAIn-AtGID1a/GA3 complex from A. thaliana (Protein Data Bank code 1ZSH). A, ribbon representation of the complex showing the AtGAIn (red ribbon), the N-terminal binding pocket cap of AtGID1a (cyan ribbon), gibberellin receptor domain of AtGID1a (light blue ribbon), and gibberellin (green van der Waals surface). B, disorder prediction for AtGID1a. C, disorder predictions for AtGAI (black line; its C-domain is shifted right to align with that of AtRGL2) and AtRGL2 (orange line). Disorder predictions were made with PONDR VLXT, where a prediction of ≥0.5 indicates a propensity for disorder, and <0.5 indicates a propensity for order. The boxes indicate the fragments of AtGAIn and AtGID1a crystallized in the complex, with the filled positions indicating the region of defined density in the crystal structure. The ticks indicate residues that interact with the portion of the complex with the corresponding colors. Interacting residues were assessed as those having a ΔASA of >10 Å2, where ΔASA is the surface area buried in the interaction calculated as the difference in surface areas of the residue in the isolated monomer and the interaction complex. Approximate positions of α-MoRFs predicted for most DELLA proteins are indicated by boxes labeled M (α-MoRF predictions shown in Fig. 1).

