FIGURE 1.
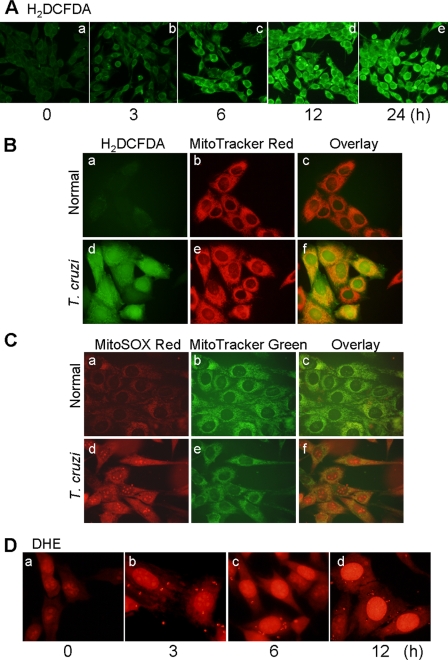
T. cruzi-induced ROS production in AC16 cardiomyocytes. A, AC16 cardiomyocytes were infected with T. cruzi (cell:parasite ratio, 1:3). Shown are representative fluorescent micrographs of AC16 cells infected for 0–24 h and stained with H2DCFDA (detects intracellular ROS, green). B, normal (panels a–c) and infected (panels d–f) cardiomyocytes at 12 h pi were stained with H2DCFDA (panels a and d) and MitoTracker Red (red, localizes to mitochondria, panels b and e). Overlay images (panels c and f, yellow) indicated mitochondria are the major source of intracellular ROS in infected cardiomyocytes. C, overlay images (panels c and f, yellow) of cardiomyocytes stained with MitoSOX Red (red, detects mtROS, panels a and d) and MitoTracker Green (green, localizes to mitochondria, panels b and e) validates mitochondrial production of ROS in infected cardiomyocytes at 12 h pi (panels d–f). D, dihydroethidium (DHE) is oxidized by cytosolic ROS to fluorescent ethidium bromide that intercalates DNA yielding a bright red nuclear fluorescence. A gradual increase in DHE fluorescence during 0–12 h pi indicates that mtROS are diffused to cytosol in infected cardiomyocytes.

