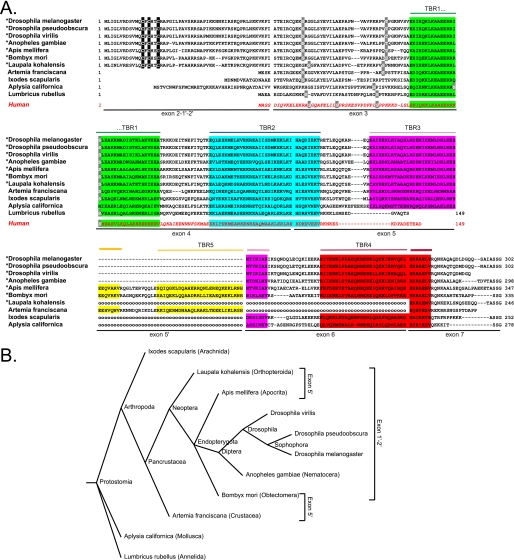
FIGURE 8.
Comparison of invertebrate stathmin sequences. A, alignment of selected invertebrate stathmin protein sequences (total sequence or part of it) together with that of h-stathmin (bottom sequence, red). TBRs (1–5) are color-shaded, exon limits are indicated, as well as potentially palmitoylated cysteines within the N-terminal targeting domain (black-shaded), and potential conserved phosphorylation sites (light gray). For the species marked with an asterisk, only the N-terminal domain coded by exon 1′-2′ and not the one coded by exon 2 is represented. The dashed lines represent a gap in the sequence and the “ooo” a gap corresponding to a missing exon that has not been detected but may exist. B, taxonomic tree obtained with the taxonomy browser at NCBI (www.ncbi.nlm.nih.gov/Taxonomy/CommonTree) showing selected invertebrate species with a stathmin-related sequence. The species with the exon 5′ coding for an additional TRB5 or with exon 1′-2′ are indicated.

