FIGURE 9.
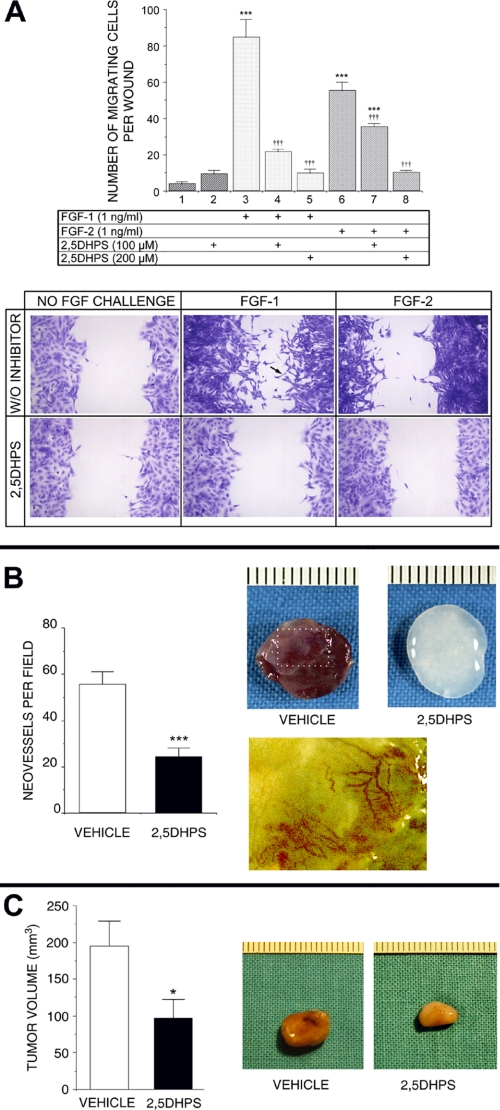
Inhibition by 2,5DHPS of FGF-induced cell migration and of uncontrolled growth in vivo. A, top panel, the effect of different doses of 2,5DHPS on the migratory phenotype induced by either FGF-1 or FGF-2 in wounded confluent cultures of fibroblasts Balb/c 3T3 cells is shown. A, bottom panel, shown are representative photographs of the experiment (2,5DHPS, 200 μm). The black arrow points to a cell with a long filopodium, a characteristic of migrating cells colonizing the denuded area. Data are plotted as the mean ± S.E. of the number of migrating cells invading the wound made in the culture. ***, p < 0.001 versus column 1; †††, p < 0.001 versus columns 3 and 6 for the wells treated with FGF-1 and FGF-2, respectively, as assessed by one-factor analysis of variance followed by the Student-Newmann-Keuls test. B, left plot, shown is the effect of orally administered 2,5DHPS on blood vessel invasion of gelatin sponges soaked in FGF-1 and implanted subcutaneously in rats. B, right panel, shown are representative photographs of the experiment. The image in the second row is an amplification of the boxed area in the image above with the color hue manually modified to better appreciate of the blood vessels. Data are plotted as the mean ± S.E. ***, p < 0.001 versus vehicle by unpaired t test. C, left panel, shown are the effects of 2,5DHPS on the progress of subcutaneously implanted rat gliomas. C, right panel, shown are representative photographs of tumors with a size representing approximately the mean of the plot at the left. The data are expressed as the mean ± S.E. of the volume of excised gliomas at the end of the intraperitoneal treatment. *, p < 0.05 versus vehicle by unpaired t test.

