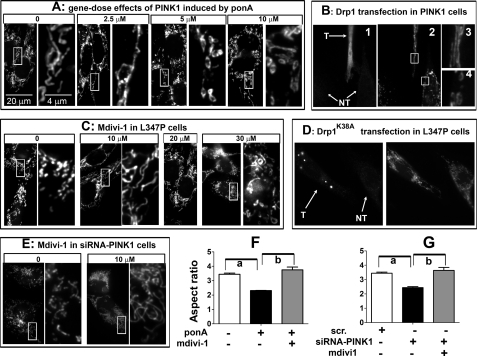
FIGURE 6.
Abnormal mitochondrial phenotype induced by PINK1 and loss of PINK1 function can be prevented through the fission/fusion pathway. A, N27 cells with inducible expression of human PINK1 were induced with varying concentrations of ponA for 24 h before MitoTracker treatment. The right panels of each treatment group are enlarged from the adjacent left boxed images. B, N27 cells as used in A were transiently transfected with Drp1 for 6 h, then induced by 10 μm ponA for 24 h. Cells were then incubated with MitoTracker Red (B2) followed by immunocytochemistry for Drp1 to identify transfected (T) cells and non-transfected (NT) cells (B1). Cells with high Drp1 expression displayed tubular mitochondria (B3), whereas non-transfected cells retained donut-shaped morphology (B4). C, N27 cells with inducible PINK1L347P were treated concurrently with 10 μm ponA and varying concentrations of the Drp1 inhibitor mdivi-1. After 24 h, mitochondrial morphology was assessed using MitoTracker Red. D, N27 cells with inducible PINK1L347P were transiently transfected with Drp1K38A plasmid for 6 h, then induced with 10 μm ponA for 24 h. Cells were then incubated with MitoTracker Red followed by immunocytochemistry for Drp1 to confirm the transfection. Transfected cells (T) displayed tubular mitochondria, whereas non-transfected cells (NT) retained fragmented mitochondrial morphology. E, empty vector cells treated with PINK1-siRNA (50 nm) for 48 h displayed mitochondrial fragmentation that was prevented by 10 μm ponA. The protective effects of mdivi1 in C and D were quantified and expressed as aspect ratio in F and G. Scr., scrambled siRNA. Data represent the mean ± S.E., analyzed by one-way ANOVA (F, F2,8 = 38.8, p < 0.001; G, F2,8 = 23.55, p < 0.001) followed by Newman-Keuls post hoc test. n > 200 mitochondria per group from three independent experiments. a, p < 0.05 compared with the respective control group; b, p < 0.05 compared with the group with mdivi-1.

