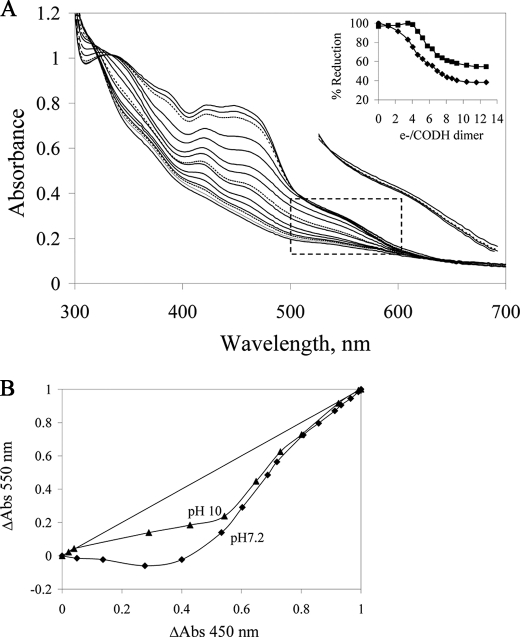
FIGURE 2.
Reductive titration of CODH with sodium dithionite under anaerobic conditions. A, spectral changes seen on titration of CODH with sodium dithionite in 50 mm potassium phosphate, pH 7.2. To the right of the main set of spectra is an enlargement of the boxed area for three spectra early in the titration, demonstrating a transient absorption increase with the earliest additions of reductant. The lowermost spectrum is that of oxidized enzyme, the dashed spectrum the enzyme after addition of the first aliquot of dithionite, and the uppermost spectrum that seen after addition of the second aliquot. Inset, absorbance changes at 450 nm (diamonds) and 550 nm (squares) versus reducing equivalents added per CODH dimer. B, plots of relative absorbance changes at 550 nm versus 450 nm at pH 7.2 (diamonds) and pH 10 (triangles).

