FIGURE 10.
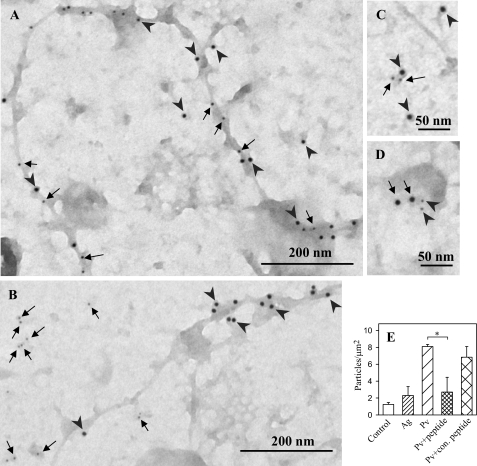
Association of PTPs with actin cytoskeleton and FcϵRI. A, plasma membrane sheets were isolated from pervanadate-activated (0.2 mm, 5 min) BMMCs. The sheets were labeled from the cytoplasmic side for oxidized PTPs with oxPTP mAb followed by GαMIgG conjugated with 12-nm gold particles (arrowheads) and for F-actin with biotin-labeled phalloidin, followed by streptavidin conjugated with 5-nm gold particles (arrows). B, BMMCs were activated with pervanadate (as in A), and plasma membrane sheets were labeled with oxPTP mAb (12 nm gold, arrowheads) and rabbit anti-SHP-2 Ab (6 nm gold, arrows). C, plasma membrane sheets were isolated from resting cells and stained on cytoplasmic side with mouse anti-FcϵRI-β mAb followed by GαMIgG conjugated with 12-nm gold particles (arrowheads), and rabbit anti-SHP-2 Ab followed by GαRIgG conjugated with 6-nm gold particles (arrows). D, alternatively, plasma membrane sheets were isolated from resting cells and stained on cytoplasmic side with mouse anti-FcϵRI-β mAb (6 nm gold; arrowheads) and rabbit anti-SHP-2 Ab (12 nm gold; arrows). Scale bars are shown at the bottom. E, quantitative analysis of SHP-2 (numbers of gold particles per μm2) in control cells or antigen (Ag)- or Pv-activated cells. Binding of SHP-2 antibody to the membrane sheets from Pv-activated cells in the presence of SHP-2 blocking peptide (peptide) or negative control (con.) peptide is also shown. Means ± S.D. were calculated from three independent experiments; each 22.2 μm2. Statistical significance of intergroup differences was calculated using Student's t test, *, p < 0.01.

