FIGURE 2.
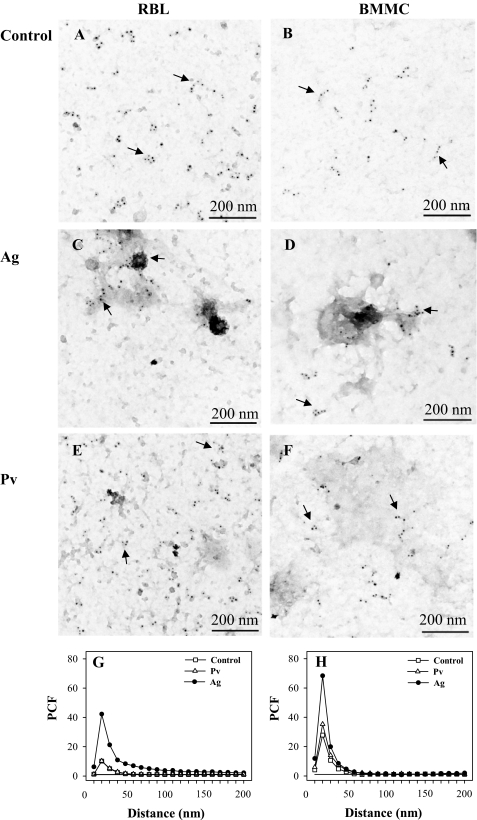
Membrane topography of FcϵRI-β subunit. A–F, IgE-sensitized RBL cells (A, C, and E) or BMMCs (B, D, and F) were nonactivated (Control; A and B) or activated for 5 min with 1 μg/ml DNP/BSA (Ag; C and D) or 0.2 mm Pv (E and F). Membrane sheets were prepared and labeled from the cytoplasmic side for FcϵRI-β subunit using JRK mAb followed by GαMIgG conjugated with 5-nm gold particles. Arrows indicate small clusters of FcϵRI. G and H, clustering of FcϵRI as determined by electron microscopy on membrane sheets (see above). PCF indicates clustering when it reaches the values higher than 1 arbitrary unit. Random distribution of gold particles (PCF = 1) is depicted by a solid line.

