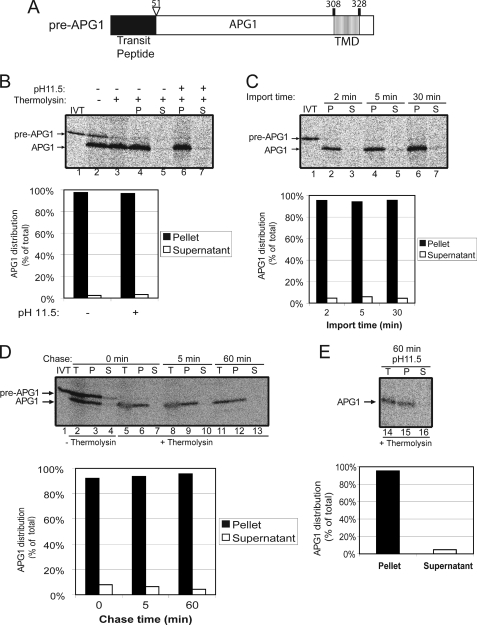
FIGURE 2.
APG1 is a stop-transfer substrate. A, schematic of the pre-APG1 protein. B, [35S]pre-APG1 was imported into isolated chloroplasts for 30 min. The chloroplasts were incubated in the presence (+) or absence (−) of thermolysin (200 μg/μl) on ice for 30 min. Proteolysis was stopped, and the chloroplasts were lysed and separated into soluble (S) and membrane (P) fractions in the presence (+) or absence (−) of 0.2 m Na2CO3, pH 11.5. The graph represents the quantification of mature APG1 in lanes 4–7. C, [35S]pre-APG1 was imported into chloroplasts for 2, 5, and 30 min at 20 °C. The reactions were stopped on ice and treated with thermolysin as in B, and equivalent fractions were collected and separated into membrane and supernatant fractions by osmotic lysis. The graph represents the quantification of APG1 in the soluble and membrane pellet fractions. D, [35S]pre-APG1 was imported into chloroplasts for 5 min at 20 °C. The reaction was stopped on ice and treated with thermolysin as in B, and import was resumed in the presence of 5 mm ATP (Chase) for the times indicated. Equivalent fractions were collected and separated into membrane and supernatant fractions by osmotic lysis. The graph represents the quantification of the distribution of APG1 during the chase. E, samples from the 60 min time point in D were treated with 0.2 m Na2CO3, pH 11.5, and separated into soluble and membrane fractions. Lane 14 (T) contains a sample equivalent to the starting material before alkaline treatment. The graph represents the distribution of APG1 between the membrane pellet and supernatant fractions.

