FIGURE 2.
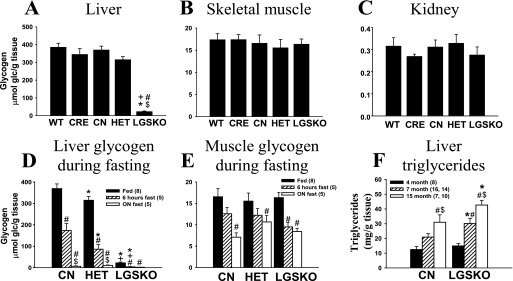
Glycogen and triglyceride content in tissues of LGSKO mice. A–C, glycogen content measured in liver (A), skeletal muscle (B), and kidney (C) (n = 8/genotype) under fed conditions of 4-month-old mice. The data are expressed as the means ± S.E. *, p < 0.05 versus CN; #, p < 0.05 versus wild type (WT); $, p < 0.05 versus CRE; +, p < 0.05 versus HET. D and E, glycogen content under random fed (black bars), 6-h fasted (hatched bars), and overnight fasted (white bars) in liver (D) and skeletal muscle (E) of 4-month old mice. *, p < 0.05 versus CN; +, p < 0.05 versus HET; #, p < 0.05 versus fed condition; $, p < 0.05 versus 6 h fasting. F, triglyceride content in liver under random fed conditions of 4-month-old (black bars, n = 8), 7-month-old (hatched bars, n = 14 for CN and n = 16 for LGSKO) and 15-month-old (white bars, n = 8 for CN and n = 10 for LGSKO) mice. *, p < 0.05 versus CN; #, p < 0.05 versus 4-month-old mice; $, p < 0.05 versus 7-month-old mice. The numbers in parentheses indicate the n for the given group. The data are expressed as the means ± S.E.

