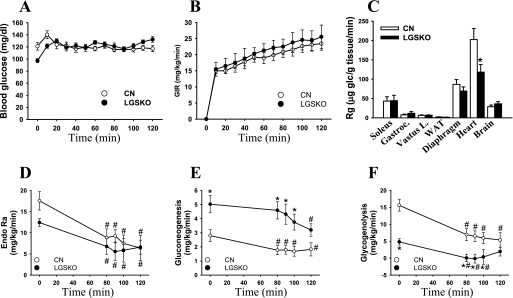
FIGURE 5.
Whole body glucose metabolism during euglycemic-hyperinsulinemic clamp in LGSKO mice. A and B, blood glucose levels (A) and glucose infusion rate (B) before and during a 120-min euglycemic-hyperinsulinemic clamp of CN (open symbols) and LGSKO (filled symbols) mice. There were no statistical differences at any time between genotypes. C, glucose uptake rate (Rg) in soleus, gastrocnemius, vastus lateralis, diaphragm, heart, white adipose tissue, and brain during the euglycemic-hyperinsulinemic clamp. D–F, endogenous glucose appearance (D, Endo Ra, as total glucose appearance minus glucose infusion), net gluconeogenesis rate (E), and glycogenolysis (as endogenous glucose appearance minus net gluconoegenesis) measured as mg of glucose/kg of mouse/min (F). n = 9–10/genotype for all of the parameters. The data are expressed as the means ± S.E. *, p < 0.05 versus CN; #, p < 0.05 versus time 0.

