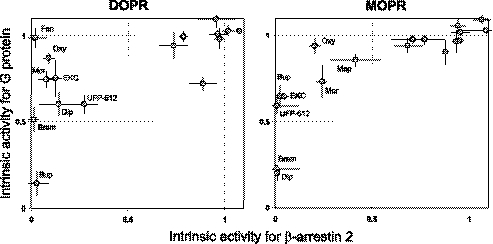
FIGURE 5.
Relationships between transducers efficacy of ligands at DOPR and MOPR. The relative intrinsic activities (Emax ligand versus Emax DADLE) computed from Tables 1 and 2 for G protein and arrestin are plotted against each other. Standard errors were calculated from the sum of variances. To improve readability, only ligands showing greater discrepancy between intrinsic activities at the two transducers were labeled in the plot (fen, fentanyl; Mep, meperidine; Oxy, oxymorphone; Brem, bremazocine; Dip, diprenorphine; Mor, morphine; Bup, buprenorphine). Regressions computed for the two sets of data yielded low correlations coefficients (0.66 ± 0.19 and 0.83 ± 0.15 for DOPR and MOPR, respectively) consistent with the lack of a linear relationship. However, both plots appear to suggest a strong hyperbolic relation between the intrinsic activities for the two transducers. Note that not all ligands of Table 1 and 2 are present in the graphs, because for some ligands intrinsic activities were not determined.

