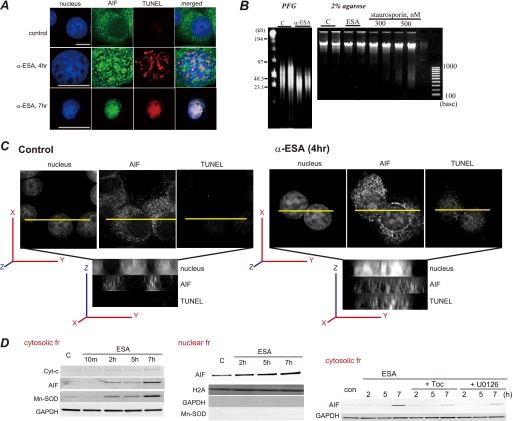
FIGURE 4.
AIF translocation to the nucleus by α-ESA. A, α-ESA induced AIF translocation from the mitochondria to the nucleus. At 4 h after the induction of apoptosis by α-ESA, AIF was translocated to the nucleus (green). The nucleus was stained with TUNEL (red) and Hoechst (blue). Scale bars show 10 μm. The TUNEL staining was scattered. By 7 h, the nucleus greatly condensed, and AIF spread throughout the nucleus. The peripheral distribution of chromatin in the α-ESA-treated cell shown was characteristic of AIF-induced stage-I condensation. Images were obtained using the deconvolution microscope. B, DNA analysis. Genomic DNA was extracted from PC12 cells that were treated with either DMSO as a control or α-ESA (2 μg/ml) for 30 h. The extracted DNA was analyzed by pulse field gel (PFG) electrophoresis. High molecular weight fragments (30–50 kb) were detected on pulse field electrophoresis. Nucleosomal DNA fragmentation was analyzed by 2% agarose gel, showing that α-ESA did not induce nucleosomal DNA degradation. C, three-dimensional images of AIF localization in the nucleus. AIF was localized in the whole nucleus, and the nucleus was stained with TUNEL. D, subcellular fractionation analysis. The release of AIF and manganese superoxide dismutase (Mn-SOD) was observed in the cytosolic fraction (fr) of α-ESA-treated cells, resulting in AIF-initiated cell death (left panel). The Western blotting of the nuclear fraction revealed AIF localization in the nucleus. There is no contamination of cytosolic and heavy membrane fractions, including mitochondria. α-Toc and U0126 blocked AIF release to the cytosolic fraction (right panel). GAPDH, glyceraldehyde-3-phosphate dehydrogenase.

