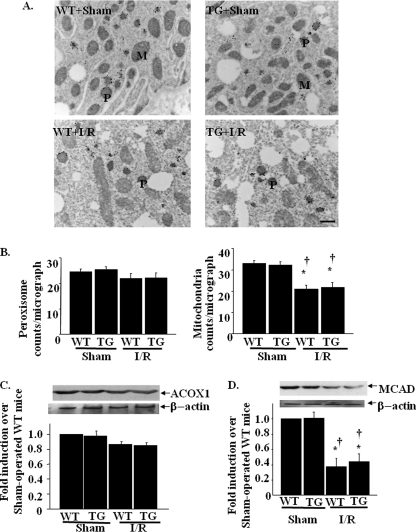
FIGURE 9.
Effects of kidney-specific Sirt1 overexpression on peroxisomal and mitochondrial in I/R-induced acute kidney injury. A, kidney tissue sections were prepared for ultrastructural analysis by immuno-EM using anti-PMP70 antibody. Representative kidney histopathology from WT and TG mice with saline or cisplatin are shown. WT and TG mice with saline showed similar numbers of peroxisomes (P) and mitochondria (M). WT mice with cisplatin showed decreased numbers of peroxisome, which were alleviated in TG mice with cisplatin. Scale bar, 1 μm. B, peroxisomal and mitochondrial number in the micrograph at the magnification of × 12,800 were calculated as described under “Experimental Procedures.” *, p < 0.05 versus saline-infused WT mice; ††, p < 0.01 versus saline-infused TG mice; §, p < 0.05 versus cisplatin-infused WT mice (n = 8). C and D, the expression levels of peroxisome protein, ACOX1 (C), and mitochondria protein MCAD (D) were analyzed by immunoblotting using kidney lysates from WT and TG mice after I/R-induced acute kidney injury. *, p < 0.05 versus sham-operated WT mice; †, p < 0.05 versus sham-operated TG mice (n = 4).

