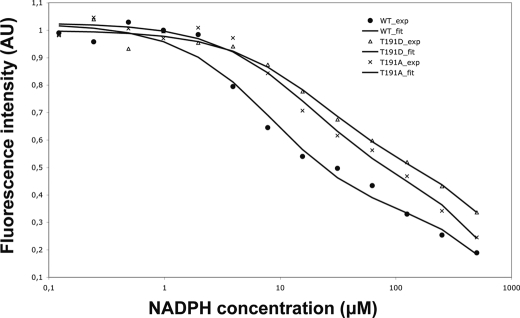
FIGURE 5.
Fluorescence emission of MabA_WT and Thr191 derivatives in the presence of increasing concentrations of NADPH. The fluorescence emission of MabA_WT was compared with those of the MabA_T191A and MabA_T191D mutants. AU, arbitrary unit. Similar data were obtained using two independent protein preparations.

