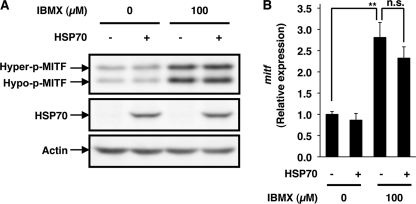
FIGURE 3.
Effect of overexpression of HSP70 on IBMX-stimulated expression of MITF. HSP70-overexpressing B16 cells (HSP70 +) or mock transfectant control cells (HSP70 −) were incubated for 3 h with or without 100 μm IBMX (A and B). Whole cell extracts were analyzed by immunoblotting as described in the legend of Fig. 1. The bands representing the hyperphosphorylated (Hyper-p) and hypophosphorylated (Hypo-p) forms of MITF are shown (A). mitf mRNA expression was monitored as described in the legend of Fig. 2B. Values are given as the mean ± S.D. (n = 3). **, p < 0.01; n.s., not significant.

