FIGURE 2.
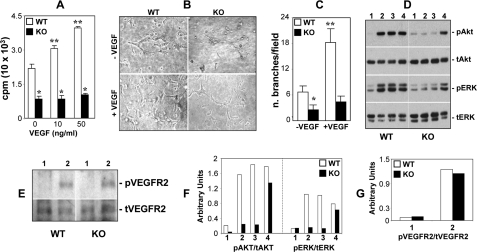
The Cyp2c44 epoxygenase is a component of VEGF-stimulated angiogenic pathways. WT and KO endothelial cells were: A, cultured in SF medium with or without the indicated VEGF concentrations and proliferation determined as described under “Experimental Procedures.” Values are averages ± S.D. calculated from three experiments performed in quadruplicates. * and ** are as in Fig. 1A. B and C, plated onto Matrigel in SF medium with or without VEGF (50 ng/ml). B, representative images of capillary-like structures taken 6 h after plating. C, capillary network formation was quantified as described under “Experimental Procedures,” and the values are averages ± S.D. of branch number per microscope field, calculated from three experiments each performed in triplicates. * and ** are as in Fig. 1A. D and E, serum starved for 24 h and then treated with vehicle, VEGF (50 ng/ml), AA (5 μm), or 11,12-EET (1 μm) (lanes 1, 2, 3, and 4, respectively) for 20 min, and an equal amount of cell lysate protein (20 μg/lane) was analyzed by Western blot for levels of activated and total ERK and Akt (D), or activated and total VEGR2 (E). Vertical lines indicate non-adjacent gel lanes. F and G, pAkt, tAkt, pERK, tERK, pVEGFR2, and tVEGFR2 bands were quantified by densitometry analysis, and the signal was expressed as a pAKt/tAkt (F), pERK/tERK (F), and pVEGFR2/tVEGFR2 (G) ratio. Values are the mean of two experiments that differ from the mean by <20%.

